SunTrust 2010 Annual Report Download - page 45
Download and view the complete annual report
Please find page 45 of the 2010 SunTrust annual report below. You can navigate through the pages in the report by either clicking on the pages listed below, or by using the keyword search tool below to find specific information within the annual report.-
 1
1 -
2
-
3
-
4
-
5
-
6
-
7
-
8
-
9
-
10
-
11
-
12
-
13
-
14
-
15
-
16
-
17
-
18
-
19
-
20
-
21
-
22
-
23
-
24
-
25
-
26
-
27
-
28
-
29
-
30
-
31
-
32
-
33
-
34
-
 35
35 -
 36
36 -
 37
37 -
 38
38 -
 39
39 -
 40
40 -
 41
41 -
 42
42 -
 43
43 -
 44
44 -
 45
45 -
 46
46 -
 47
47 -
 48
48 -
 49
49 -
 50
50 -
 51
51 -
 52
52 -
 53
53 -
 54
54 -
 55
55 -
56
-
57
-
58
-
59
-
60
-
61
-
62
-
63
-
64
-
65
-
66
-
67
-
68
-
69
-
70
-
71
-
72
-
73
-
74
-
75
-
76
-
77
-
78
-
79
-
80
-
81
-
82
-
83
-
84
-
85
-
86
-
87
-
88
-
89
-
90
-
91
-
92
-
93
-
94
-
95
-
96
-
97
-
98
-
99
-
100
-
101
-
102
-
103
-
104
-
105
-
106
-
107
-
108
-
109
-
110
-
111
-
112
-
113
-
114
-
115
-
116
-
117
-
118
-
119
-
120
-
121
-
122
-
123
-
124
-
125
-
126
-
127
-
128
-
129
-
130
-
131
-
132
-
133
-
134
-
135
-
136
-
137
-
138
-
139
-
140
-
141
-
142
-
143
-
144
-
145
-
146
-
147
-
148
-
149
-
150
-
151
-
152
-
153
-
154
-
155
-
156
-
157
-
158
-
159
-
160
-
161
-
162
-
163
-
164
-
165
-
166
-
167
-
168
-
169
-
170
-
171
-
172
-
173
-
174
-
175
-
176
-
177
-
178
-
179
-
180
-
181
-
182
-
183
-
184
-
185
-
186
-
187
-
188
-
189
-
190
-
191
-
192
-
193
-
194
-
195
-
196
-
197
-
198
-
199
-
200
-
201
-
202
-
203
-
204
-
205
-
206
-
207
-
208
-
209
-
210
-
211
-
212
-
213
-
214
-
215
-
216
-
217
-
218
-
219
-
220
 |
 |
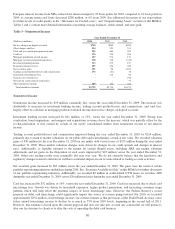
a result of the consolidation of off-balance sheet entities under new accounting guidance effective January 1, 2010, we
realized an additional $45 million in net interest income during the year. The consolidations resulted in the
re-characterization of fees earned by certain of our newly consolidated entities from noninterest income to net interest
income. The effect of this consolidation resulted in a small dilutive impact to net interest margin. Previously, we recorded
income on these off-balance sheet entities primarily within investment banking income in noninterest income.
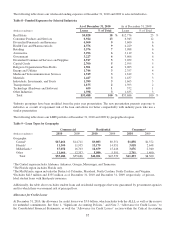
Average earning assets decreased $3.7 billion, or 2%, from 2009, while average interest-bearing liabilities declined $4.9
billion, or 4%. Average loans decreased $7.1 billion, or 6%. The decline in loans was attributable to a $3.7 billion, or 10%,
reduction in commercial loans, a $2.6 billion, or 43%, reduction in real estate construction loans, a $995 million, or 6%,
reduction in real estate commercial, and a $773 million, or 5%, reduction in real estate home equity loans. These decreases
were partially offset by increases of $936 million, or 14%, in consumer-indirect loans, driven by purchases of high quality
auto loan portfolios and $711 million, or 14%, in consumer-direct loans. Average LHFS were $3.3 billion, a decrease of $1.9
billion, or 37%, from 2009. The decrease in LHFS occurred as a result of decreased mortgage loan production refinance
activity during the year, as well as a reduction in student loans held for sale due to recently enacted legislation eliminating
our ability to originate and sell this product. Reduced demand in borrowing among credit-worthy clients coupled with our
efforts to reduce higher-risk loan portfolios has resulted in an overall decrease in loan balances, which coupled with higher
deposit levels, has led us to seek other investment opportunities, causing an increase in average securities AFS. Average
securities AFS increased $5.8 billion, or 29%, due to increases of $4.5 billion in U.S. Treasury and agency securities, $930
million in MBS, and $711 million in ABS. These positions were added during a declining rate environment resulting in a 102
basis point decline in the weighted average yield on securities AFS compared to 2009. See additional discussion in the
“Securities Available for Sale” section included in this MD&A for more information on the repositioning of our securities
AFS portfolio.
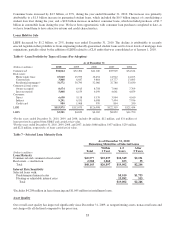
Our loan portfolio yielded 4.74% for the year, up 8 basis points from 2009. Since a large percentage of our commercial loans
are variable rate indexed to one month LIBOR, we utilize receive fixed/pay floating interest rate swaps to manage interest
rate risk. As of December 31, 2010, the outstanding notional balance of swaps was $15.9 billion, which qualified as cash
flow hedges on variable rate commercial loans compared to $18.6 billion as of December 31, 2009. Swap income increased
from $539 million in 2009 to $617 million in 2010, primarily due to increased realized gains on terminated swaps during
2010 and one month LIBOR being lower in 2010 compared to 2009. While the underlying loans swapped to fixed rates are
classified as both CRE and commercial, all of the swap income is recorded as interest on commercial loans. The
classification of all swap income in the commercial loan category and the declining balance of average commercial loans
produced an increase in reported commercial loan yields as compared to a decrease in underlying rate indices. In addition,
loan-related interest income has been augmented by improved risk-based pricing discipline.
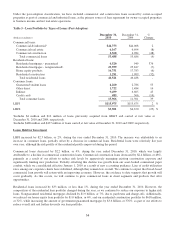
Average consumer and commercial deposits increased $4.0 billion, or 4%, in 2010 compared to 2009. This growth consisted
of increases of $7.0 billion, or 22%, in money market accounts, $1.1 billion, or 5%, in NOW accounts, and $1.9 billion, or
8%, in demand deposits, partially offset by a decline of $6.3 billion, or 21%, in consumer and commercial time deposits.
Low cost deposit growth was the result of marketing campaigns, competitive pricing and clients’ increased preference for
more liquid products. However, a portion of the deposit growth is related to reduced client demand for sweep accounts due to
the low interest rate environment. The overall growth in consumer and commercial deposits allowed for a reduction in other
funding sources, including $4.0 billion of long-term debt and $3.1 billion of brokered deposits. Overall, average interest-
bearing liabilities declined $4.9 billion, or 4%. We continue to pursue deposit growth initiatives to increase our presence in
specific markets within our footprint. Competition for deposits remains strong, and as a result, deposit pricing pressure
remains across our footprint. Despite these challenging market conditions, we have used a combination of regional and
product-specific pricing initiatives to balance margin and volume, while still growing our average deposit balances. While
we acknowledge some of this growth is seasonal and influenced by the current economic environment, we also believe that
the growth is the direct result of investments that we have made to enhance our clients’ banking experience and to drive
household and market share growth.
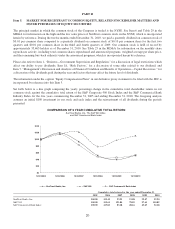
During 2010, the interest rate environment was characterized by flat short-term rates and lower medium- and long-term rates,
resulting in a flatter yield curve versus 2009. More specifically, the Fed funds target rate averaged 0.25%, unchanged from
last year, the Prime rate averaged 3.25%, unchanged from last year, one-month LIBOR averaged 0.27%, a decrease of 6 basis
points, three-month LIBOR averaged 0.34%, a decrease of 31 basis points, five-year swaps averaged 2.10%, a decrease of 55
basis points, and ten-year swaps averaged 3.18%, a decrease of 26 basis points.
29