SunTrust 2010 Annual Report Download - page 47
Download and view the complete annual report
Please find page 47 of the 2010 SunTrust annual report below. You can navigate through the pages in the report by either clicking on the pages listed below, or by using the keyword search tool below to find specific information within the annual report.-
 1
1 -
2
-
3
-
4
-
5
-
6
-
7
-
8
-
9
-
10
-
11
-
12
-
13
-
14
-
15
-
16
-
17
-
18
-
19
-
20
-
21
-
22
-
23
-
24
-
25
-
26
-
27
-
28
-
29
-
30
-
31
-
32
-
33
-
34
-
35
-
36
-
 37
37 -
 38
38 -
 39
39 -
 40
40 -
 41
41 -
 42
42 -
 43
43 -
 44
44 -
 45
45 -
 46
46 -
 47
47 -
 48
48 -
 49
49 -
 50
50 -
 51
51 -
 52
52 -
 53
53 -
 54
54 -
 55
55 -
 56
56 -
 57
57 -
58
-
59
-
60
-
61
-
62
-
63
-
64
-
65
-
66
-
67
-
68
-
69
-
70
-
71
-
72
-
73
-
74
-
75
-
76
-
77
-
78
-
79
-
80
-
81
-
82
-
83
-
84
-
85
-
86
-
87
-
88
-
89
-
90
-
91
-
92
-
93
-
94
-
95
-
96
-
97
-
98
-
99
-
100
-
101
-
102
-
103
-
104
-
105
-
106
-
107
-
108
-
109
-
110
-
111
-
112
-
113
-
114
-
115
-
116
-
117
-
118
-
119
-
120
-
121
-
122
-
123
-
124
-
125
-
126
-
127
-
128
-
129
-
130
-
131
-
132
-
133
-
134
-
135
-
136
-
137
-
138
-
139
-
140
-
141
-
142
-
143
-
144
-
145
-
146
-
147
-
148
-
149
-
150
-
151
-
152
-
153
-
154
-
155
-
156
-
157
-
158
-
159
-
160
-
161
-
162
-
163
-
164
-
165
-
166
-
167
-
168
-
169
-
170
-
171
-
172
-
173
-
174
-
175
-
176
-
177
-
178
-
179
-
180
-
181
-
182
-
183
-
184
-
185
-
186
-
187
-
188
-
189
-
190
-
191
-
192
-
193
-
194
-
195
-
196
-
197
-
198
-
199
-
200
-
201
-
202
-
203
-
204
-
205
-
206
-
207
-
208
-
209
-
210
-
211
-
212
-
213
-
214
-
215
-
216
-
217
-
218
-
219
-
220
 |
 |
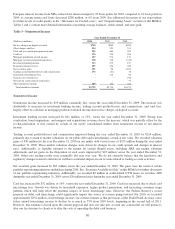
Trust and investment management income increased by $17 million, or 3%, versus the year ended December 31, 2009. The
increase was attributable to higher market valuations on managed equity assets and fixed income asset inflows, partially
offset by lower money market mutual fund revenue.
Mortgage servicing related income increased $28 million, or 8%, versus the year ended December 31, 2009, due to higher
servicing fees, partially offset by the negative impact of increased prepayments during 2010.
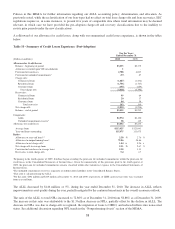
Mortgage production related income decreased by $249 million, or 66%, versus the year ended December 31, 2009. The
decrease was due to a $21 billion, or 42%, decline in loan production. The provision for mortgage repurchase related losses
for the year ended December 31, 2010 increased by 3% to $456 million versus $444 million for the year ended December 31,
2009. As of December 31, 2010, the reserve for mortgage repurchase losses was $265 million, an increase of $65 million
versus the prior year. The increase in the reserve was due to a continued increase in repurchase requests during 2010 and
expected elevated levels for the foreseeable future.
We expect future repurchase related losses and reserves will be largely driven by the volume of repurchase requests received
from the GSEs, which have exhibited considerable month to month volatility. To date, the majority of our repurchase
requests have been associated with 2006 and 2007 vintages, which produce higher losses. We expect that normal seasoning
patterns for origination vintages, over time, will shift new repurchase requests to newer production vintages which have a
lower risk profile. As that occurs, we expect lower aggregate request volumes and lower loss frequencies and severities, as
the newer vintages exhibit more favorable characteristics, such as higher FICOs and lower original LTVs, as they were
originated during or after periods that experienced the most significant home price depreciation. If our assumptions are
correct, we expect a favorable impact on noninterest income from curtailed mortgage repurchases losses in 2011.
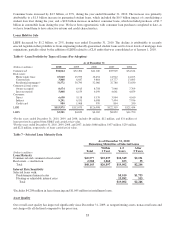
With respect to non-agency loan sales, we have sold $30.3 billion of such loans since 2005, with an insignificant amount of
such sales occurring after 2007. Of this amount, we estimate that $16.7 billion is still outstanding. In addition to outstanding
loans, our repurchase exposure includes loans no longer outstanding due to foreclosures or short sales. To date, we have
received a modest number of repurchase requests regarding such loans, which have not resulted in any material repurchase
related losses. While our losses have not been significant, we have been factoring our non-agency loss experience into our
mortgage repurchase reserve process. However, if such repurchase requests increase materially in the future, we could suffer
additional losses. See Part I, Item 1A, “Risk Factors” to this Annual Report on Form 10-K and Note 18, “Reinsurance
Arrangements and Guarantees – Loan Sales,” to the Consolidated Financial Statements for additional information.
Service charges on deposit accounts decreased by $88 million, or 10%, versus the year ended December 31, 2009. The
decreases were attributable to the implementation of Regulation E changes and a voluntary decision to eliminate overdraft
fees on very small individual transactions, as well as reducing the maximum number of daily overdraft fees. The voluntary
changes were in place for the entire third quarter while the Regulation E changes became effective in the middle of the third
quarter. Until clients have fully exercised their opt-in opportunity and reacted to our client satisfaction initiatives around
overdraft fees, we expect service charge income to decline over the next few quarters, with the reduction gradually
moderating over time. The effects of adopting Regulation E and our voluntary overdraft changes impacted our fourth quarter
results and are expected to have a full-year impact within the range of $120 to $170 million. This estimate, however, does not
consider any mitigating actions that we may take.
Retail investment services income decreased by $13 million, or 6%, versus the year ended December 31, 2009. The decrease
was attributable to declines to fixed annuity revenue, partially offset by increased recurring brokerage revenue linked to the
equity markets and increased transactional revenue from variable annuity and mutual fund sales.
Other income increased by $25 million, or 15%, versus the year ended December 31, 2009. The increase was largely
attributable to a $24 million reduction in net losses recognized on certain private equity investments as compared to the prior
year.
31