SunTrust 2010 Annual Report Download - page 63
Download and view the complete annual report
Please find page 63 of the 2010 SunTrust annual report below. You can navigate through the pages in the report by either clicking on the pages listed below, or by using the keyword search tool below to find specific information within the annual report.-
 1
1 -
2
-
3
-
4
-
5
-
6
-
7
-
8
-
9
-
10
-
11
-
12
-
13
-
14
-
15
-
16
-
17
-
18
-
19
-
20
-
21
-
22
-
23
-
24
-
25
-
26
-
27
-
28
-
29
-
30
-
31
-
32
-
33
-
34
-
35
-
36
-
37
-
38
-
39
-
40
-
41
-
42
-
43
-
44
-
45
-
46
-
47
-
48
-
49
-
50
-
51
-
52
-
 53
53 -
 54
54 -
 55
55 -
 56
56 -
 57
57 -
 58
58 -
 59
59 -
 60
60 -
 61
61 -
 62
62 -
 63
63 -
 64
64 -
 65
65 -
 66
66 -
 67
67 -
 68
68 -
 69
69 -
 70
70 -
 71
71 -
 72
72 -
 73
73 -
74
-
75
-
76
-
77
-
78
-
79
-
80
-
81
-
82
-
83
-
84
-
85
-
86
-
87
-
88
-
89
-
90
-
91
-
92
-
93
-
94
-
95
-
96
-
97
-
98
-
99
-
100
-
101
-
102
-
103
-
104
-
105
-
106
-
107
-
108
-
109
-
110
-
111
-
112
-
113
-
114
-
115
-
116
-
117
-
118
-
119
-
120
-
121
-
122
-
123
-
124
-
125
-
126
-
127
-
128
-
129
-
130
-
131
-
132
-
133
-
134
-
135
-
136
-
137
-
138
-
139
-
140
-
141
-
142
-
143
-
144
-
145
-
146
-
147
-
148
-
149
-
150
-
151
-
152
-
153
-
154
-
155
-
156
-
157
-
158
-
159
-
160
-
161
-
162
-
163
-
164
-
165
-
166
-
167
-
168
-
169
-
170
-
171
-
172
-
173
-
174
-
175
-
176
-
177
-
178
-
179
-
180
-
181
-
182
-
183
-
184
-
185
-
186
-
187
-
188
-
189
-
190
-
191
-
192
-
193
-
194
-
195
-
196
-
197
-
198
-
199
-
200
-
201
-
202
-
203
-
204
-
205
-
206
-
207
-
208
-
209
-
210
-
211
-
212
-
213
-
214
-
215
-
216
-
217
-
218
-
219
-
220
 |
 |

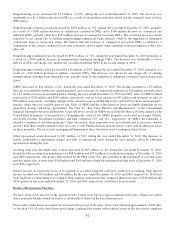
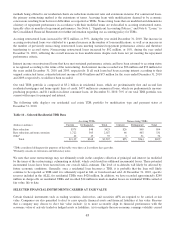
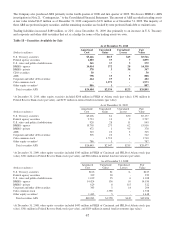
The Company also purchased ARS primarily in the fourth quarter of 2008 and first quarter of 2009. We discuss FINRA’s ARS
investigation in Note 21, “Contingencies,” to the Consolidated Financial Statements. The amount of ARS recorded in trading assets
at fair value totaled $147 million as of December 31, 2010 compared to $176 million as of December 31, 2009. The majority of
these ARS are preferred equity securities, and the remaining securities are backed by trust preferred bank debt or student loans.
Trading liabilities increased $489 million, or 22%, since December 31, 2009 due primarily to an increase in U.S. Treasury
and corporate and other debt securities that act as a hedge for some of the trading assets we own.
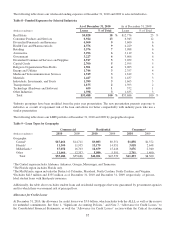
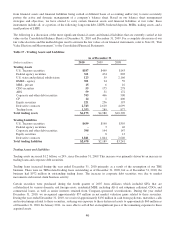
Table 18 – Securities Available for Sale
As of December 31, 2010
(Dollars in millions)
Amortized
Cost
Unrealized
Gains
Unrealized
Losses
Fair
Value
U.S. Treasury securities $5,446 $115 $45 $5,516
Federal agency securities 1,883 19 7 1,895
U.S. states and political subdivisions 565 17 3 579
RMBS - agency 14,014 372 28 14,358
RMBS - private 378 3 34 347
CDO securities 50 - - 50
ABS 798 15 5 808
Corporate and other debt securities 464 19 1 482
Coke common stock - 1,973 - 1,973
Other equity securities1886 1 - 887
Total securities AFS $24,484 $2,534 $123 $26,895
1At December 31, 2010, other equity securities included $298 million in FHLB of Atlanta stock (par value), $391 million in
Federal Reserve Bank stock (par value), and $197 million in mutual fund investments (par value).
As of December 31, 2009
(Dollars in millions)
Amortized
Cost
Unrealized
Gains
Unrealized
Losses
Fair
Value
U.S. Treasury securities $5,206 $1 $30 $5,177
Federal agency securities 2,733 13 9 2,737
U.S. states and political subdivisions 928 28 11 945
RMBS - agency 15,705 273 62 15,916
RMBS - private 472 1 95 378
ABS 310 10 5 315
Corporate and other debt securities 505 10 3 512
Coke common stock - 1,710 - 1,710
Other equity securities1786 1 - 787
Total securities AFS $26,645 $2,047 $215 $28,477
1At December 31, 2009, other equity securities included $343 million in FHLB of Cincinnati and FHLB of Atlanta stock (par
value), $361 million in Federal Reserve Bank stock (par value), and $82 million in mutual fund investments (par value).
As of December 31, 2008
(Dollars in millions)
Amortized
Cost
Unrealized
Gains
Unrealized
Losses
Fair
Value
U.S. Treasury securities $126 $1 $- $127
Federal agency securities 339 20 - 359
U.S. states and political subdivisions 1,019 25 6 1,038
RMBS - agency 14,424 136 10 14,550
RMBS - private 629 8 115 522
Corporate and other debt securities 303 5 14 294
Coke common stock - 1,358 - 1,358
Other equity securities11,443 5 - 1,448
Total securities AFS $18,283 $1,558 $145 $19,696
1At December 31, 2008, other equity securities included $493 million in FHLB of Cincinnati and FHLB of Atlanta stock (par
value), $361 million in Federal Reserve Bank stock (par value), and $589 million in mutual fund investments (par value).
47