SunTrust 2010 Annual Report Download - page 108
Download and view the complete annual report
Please find page 108 of the 2010 SunTrust annual report below. You can navigate through the pages in the report by either clicking on the pages listed below, or by using the keyword search tool below to find specific information within the annual report.-
 1
1 -
2
-
3
-
4
-
5
-
6
-
7
-
8
-
9
-
10
-
11
-
12
-
13
-
14
-
15
-
16
-
17
-
18
-
19
-
20
-
21
-
22
-
23
-
24
-
25
-
26
-
27
-
28
-
29
-
30
-
31
-
32
-
33
-
34
-
35
-
36
-
37
-
38
-
39
-
40
-
41
-
42
-
43
-
44
-
45
-
46
-
47
-
48
-
49
-
50
-
51
-
52
-
53
-
54
-
55
-
56
-
57
-
58
-
59
-
60
-
61
-
62
-
63
-
64
-
65
-
66
-
67
-
68
-
69
-
70
-
71
-
72
-
73
-
74
-
75
-
76
-
77
-
78
-
79
-
80
-
81
-
82
-
83
-
84
-
85
-
86
-
87
-
88
-
89
-
90
-
91
-
92
-
93
-
94
-
95
-
96
-
97
-
 98
98 -
 99
99 -
 100
100 -
 101
101 -
 102
102 -
 103
103 -
 104
104 -
 105
105 -
 106
106 -
 107
107 -
 108
108 -
 109
109 -
 110
110 -
 111
111 -
 112
112 -
 113
113 -
 114
114 -
 115
115 -
 116
116 -
 117
117 -
 118
118 -
119
-
120
-
121
-
122
-
123
-
124
-
125
-
126
-
127
-
128
-
129
-
130
-
131
-
132
-
133
-
134
-
135
-
136
-
137
-
138
-
139
-
140
-
141
-
142
-
143
-
144
-
145
-
146
-
147
-
148
-
149
-
150
-
151
-
152
-
153
-
154
-
155
-
156
-
157
-
158
-
159
-
160
-
161
-
162
-
163
-
164
-
165
-
166
-
167
-
168
-
169
-
170
-
171
-
172
-
173
-
174
-
175
-
176
-
177
-
178
-
179
-
180
-
181
-
182
-
183
-
184
-
185
-
186
-
187
-
188
-
189
-
190
-
191
-
192
-
193
-
194
-
195
-
196
-
197
-
198
-
199
-
200
-
201
-
202
-
203
-
204
-
205
-
206
-
207
-
208
-
209
-
210
-
211
-
212
-
213
-
214
-
215
-
216
-
217
-
218
-
219
-
220
 |
 |

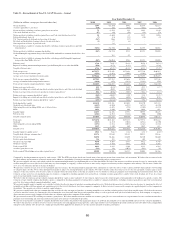
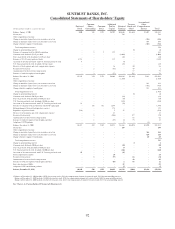
SUNTRUST BANKS, INC.
Consolidated Statements of Shareholders’ Equity
(Dollars and shares in millions, except per share data)
Preferred
Stock
Common
Shares
Outstanding
Common
Stock
Additional
Paid in
Capital
Retained
Earnings
Treasury
Stock and
Other1
Accumulated
Other
Comprehensive
Income Total
Balance, January 1, 2008 $500 348 $371 $6,707 $10,646 ($1,662) $1,607 $18,169
Net income - - - - 796 - - 796
Other comprehensive income:
Change in unrealized gains (losses) on securities, net of tax - - - - - - (806) (806)
Change in unrealized gains (losses) on derivatives, net of tax - - - - - - 688 688
Change related to employee benefit plans - - - - - - (508) (508)
Total comprehensive income 170
Change in noncontrolling interest - - - - - (5) - (5)
Issuance of common stock for GB&T acquisition - 2 2 152 - - - 154
Common stock dividends, $2.85 per share - - - - (1,004) - - (1,004)
Series A preferred stock dividends, $4,451 per share - - - - (22) - - (22)
Issuance of U.S. Treasury preferred stock 4,718 - - 132 - - - 4,850
Accretion of discount associated with U.S. Treasury preferred stock 4 - - - (4) - - -
U.S. Treasury preferred stock dividends, $471 per share - - - - (23) - - (23)
Exercise of stock options and stock compensation expense - - - 16 - 40 - 56
Restricted stock activity - 2 - (46) - 47 - 1
Amortization of restricted stock compensation - - - - - 77 - 77
Issuance of stock for employee benefit plans - 2 - (57) - 135 - 78
Balance, December 31, 2008 $5,222 354 $373 $6,904 $10,389 ($1,368) $981 $22,501
Net loss - - - - (1,564) - - (1,564)
Other comprehensive income:
Change in unrealized gains (losses) on securities, net of tax - - - - - - 281 281
Change in unrealized gains (losses) on derivatives, net of tax - - - - - - (435) (435)
Change related to employee benefit plans - - - - - - 251 251
Total comprehensive loss (1,467)
Change in noncontrolling interest - - - - - (5) - (5)
Common stock dividends, $0.22 per share - - - - (83) - - (83)
Series A preferred stock dividends, $4,056 per share - - - - (14) - - (14)
U.S. Treasury preferred stock dividends, $5,004 per share - - - - (243) - - (243)
Accretion of discount associated with U.S. Treasury preferred stock 23 - - - (23) - - -
Issuance of common stock in connection with SCAP capital plan - 142 142 1,688 - - - 1,830
Extinguishment of forward stock purchase contract - - - 174 - - - 174
Repurchase of preferred stock (328) - - 5 95 - - (228)
Exercise of stock options and stock compensation expense - - - 11 - - - 11
Restricted stock activity - 2 - (206) - 177 - (29)
Amortization of restricted stock compensation - - - - - 66 - 66
Issuance of stock for employee benefit plans and other - 1 - (55) (2) 75 - 18
Adoption of OTTI guidance - - - - 8 - (8) -
Balance, December 31, 2009 $4,917 499 $515 $8,521 $8,563 ($1,055) $1,070 $22,531
Net income - - - - 189 - - 189
Other comprehensive income:
Change in unrealized gains (losses) on securities, net of tax - - - - - - 366 366
Change in unrealized gains (losses) on derivatives, net of tax - - - - - - 120 120
Change related to employee benefit plans - - - - - - 60 60
Total comprehensive income 735
Change in noncontrolling interest -----4 -4
Common stock dividends, $0.04 per share - - - - (20) - - (20)
Series A preferred stock dividends, $4,056 per share - - - - (7) - - (7)
U.S. Treasury preferred stock dividends, $5,000 per share - - - - (242) - - (242)
Accretion of discount associated with U.S. Treasury preferred stock 25 - - - (25) - - -
Stock compensation expense ---24-- -24
Restricted stock activity - 1 - (97) - 66 - (31)
Amortization of restricted stock compensation -----42 -42
Issuance of stock for employee benefit plans and other - - - (45) 2 55 - 12
Fair value election of MSRs - - - - 89 - - 89
Adoption of VIE consolidation guidance -- - - (7) - - (7)
Balance, December 31, 2010 $4,942 500 $515 $8,403 $8,542 ($888) $1,616 $23,130
1 Balance at December 31, 2010 includes ($974) for treasury stock, ($43) for compensation element of restricted stock, $129 for noncontrolling interest.
Balance at December 31, 2009 includes ($1,104) for treasury stock, ($59) for compensation element of restricted stock, $108 for noncontrolling interest.
Balance at December 31, 2008 includes ($1,368) for treasury stock, ($113) for compensation element of restricted stock, $113 for noncontrolling interest.
See Notes to Consolidated Financial Statements.
92