SunTrust 2010 Annual Report Download - page 140
Download and view the complete annual report
Please find page 140 of the 2010 SunTrust annual report below. You can navigate through the pages in the report by either clicking on the pages listed below, or by using the keyword search tool below to find specific information within the annual report.-
 1
1 -
2
-
3
-
4
-
5
-
6
-
7
-
8
-
9
-
10
-
11
-
12
-
13
-
14
-
15
-
16
-
17
-
18
-
19
-
20
-
21
-
22
-
23
-
24
-
25
-
26
-
27
-
28
-
29
-
30
-
31
-
32
-
33
-
34
-
35
-
36
-
37
-
38
-
39
-
40
-
41
-
42
-
43
-
44
-
45
-
46
-
47
-
48
-
49
-
50
-
51
-
52
-
53
-
54
-
55
-
56
-
57
-
58
-
59
-
60
-
61
-
62
-
63
-
64
-
65
-
66
-
67
-
68
-
69
-
70
-
71
-
72
-
73
-
74
-
75
-
76
-
77
-
78
-
79
-
80
-
81
-
82
-
83
-
84
-
85
-
86
-
87
-
88
-
89
-
90
-
91
-
92
-
93
-
94
-
95
-
96
-
97
-
98
-
99
-
100
-
101
-
102
-
103
-
104
-
105
-
106
-
107
-
108
-
109
-
110
-
111
-
112
-
113
-
114
-
115
-
116
-
117
-
118
-
119
-
120
-
121
-
122
-
123
-
124
-
125
-
126
-
127
-
128
-
129
-
 130
130 -
 131
131 -
 132
132 -
 133
133 -
 134
134 -
 135
135 -
 136
136 -
 137
137 -
 138
138 -
 139
139 -
 140
140 -
 141
141 -
 142
142 -
 143
143 -
 144
144 -
 145
145 -
 146
146 -
 147
147 -
 148
148 -
 149
149 -
 150
150 -
151
-
152
-
153
-
154
-
155
-
156
-
157
-
158
-
159
-
160
-
161
-
162
-
163
-
164
-
165
-
166
-
167
-
168
-
169
-
170
-
171
-
172
-
173
-
174
-
175
-
176
-
177
-
178
-
179
-
180
-
181
-
182
-
183
-
184
-
185
-
186
-
187
-
188
-
189
-
190
-
191
-
192
-
193
-
194
-
195
-
196
-
197
-
198
-
199
-
200
-
201
-
202
-
203
-
204
-
205
-
206
-
207
-
208
-
209
-
210
-
211
-
212
-
213
-
214
-
215
-
216
-
217
-
218
-
219
-
220
 |
 |

SUNTRUST BANKS, INC.
Notes to Consolidated Financial Statements (Continued)
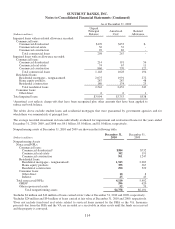
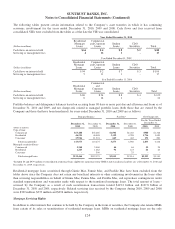
The following tables present certain information related to the Company’s asset transfers in which it has continuing
economic involvement for the years ended December 31, 2010, 2009 and 2008. Cash flows and fees received from
consolidated VIEs were excluded from the tables as of the date the VIE was consolidated.
Year Ended December 31, 2010
(Dollars in millions)
Residential
Mortgage
Loans
Commercial
and Corporate
Loans
Student
Loans
CDO
Securities Total
Cash flows on interests held $66$4$8$2$80
Servicing or management fees 412 1 - 17
Year Ended December 31, 2009
(Dollars in millions)
Residential
Mortgage
Loans
Commercial
and Corporate
Loans
Student
Loans
CDO
Securities Total
Cash flows on interests held $ 94 $ 2 $ 7 $ 3 $ 106
Servicing or management fees 5 11 1 - 17
Year Ended December 31, 2008
(Dollars in millions)
Residential
Mortgage
Loans
Commercial
and
Corporate
Loans
Student
Loans
CDO
Securities Total
Cash flows on interests held $ 86 $ 24 $ 8 $ 4 $ 122
Servicing or management fees 6 14 1 - 21
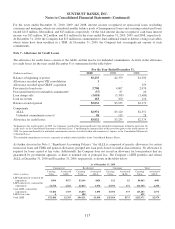
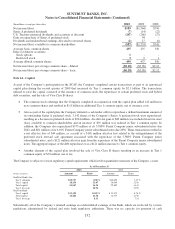
Portfolio balances and delinquency balances based on accruing loans 90 days or more past due and all nonaccrual loans as of
December 31, 2010 and 2009, and net charge-offs related to managed portfolio loans (both those that are owned by the
Company and those that have been transferred) for years ended December 31, 2010 and 2009 are as follows:
Principal Balance Past Due1Net Charge-offs
(Dollars in millions)
December 31,
2010
December 31,
2009
December 31,
2010
December 31,
2009
For the Years Ended
December 31,
2010 2009
Type of loan:
Commercial $53,488 $55,686 $1,904 $2,232 $988 $1,348
Residential 46,521 46,488 3,122 4,228 1,716 1,690
Consumer 15,966 11,501 649 442 151 200
Total loan portfolio 115,975 113,675 5,675 6,902 2,855 3,238
Managed securitized loans
Commercial 2,244 3,460 44 64 22 28
Residential 1,245 1,482 96 123 46 44
Consumer -506 -25 --
Total managed loans $119,464 $119,123 $5,815 $7,114 $2,923 $3,310
1Included $0 and $979 million of consolidated residential loans eligible for repurchase from GNMA and classified as held for sale at December 31, 2010 and
December 31, 2009, respectively.
Residential mortgage loans securitized through Ginnie Mae, Fannie Mae, and Freddie Mac have been excluded from the
tables above since the Company does not retain any beneficial interests or other continuing involvement in the loans other
than servicing responsibilities on behalf of Ginnie Mae, Fannie Mae, and Freddie Mac, and repurchase contingencies under
standard representations and warranties made with respect to the transferred mortgage loans. The total amount of loans -
serviced by the Company as a result of such securitization transactions totaled $119.2 billion and $127.8 billion at
December 31, 2010 and 2009, respectively. Related servicing fees received by the Company during 2010, 2009 and 2008
were $369 million, $333 million and $294 million, respectively.
Mortgage Servicing Rights
In addition to other interests that continue to be held by the Company in the form of securities, the Company also retains MSRs
from certain of its sales or securitizations of residential mortgage loans. MSRs on residential mortgage loans are the only
124