SunTrust 2010 Annual Report Download - page 94
Download and view the complete annual report
Please find page 94 of the 2010 SunTrust annual report below. You can navigate through the pages in the report by either clicking on the pages listed below, or by using the keyword search tool below to find specific information within the annual report.-
 1
1 -
2
-
3
-
4
-
5
-
6
-
7
-
8
-
9
-
10
-
11
-
12
-
13
-
14
-
15
-
16
-
17
-
18
-
19
-
20
-
21
-
22
-
23
-
24
-
25
-
26
-
27
-
28
-
29
-
30
-
31
-
32
-
33
-
34
-
35
-
36
-
37
-
38
-
39
-
40
-
41
-
42
-
43
-
44
-
45
-
46
-
47
-
48
-
49
-
50
-
51
-
52
-
53
-
54
-
55
-
56
-
57
-
58
-
59
-
60
-
61
-
62
-
63
-
64
-
65
-
66
-
67
-
68
-
69
-
70
-
71
-
72
-
73
-
74
-
75
-
76
-
77
-
78
-
79
-
80
-
81
-
82
-
83
-
 84
84 -
 85
85 -
 86
86 -
 87
87 -
 88
88 -
 89
89 -
 90
90 -
 91
91 -
 92
92 -
 93
93 -
 94
94 -
 95
95 -
 96
96 -
 97
97 -
 98
98 -
 99
99 -
 100
100 -
 101
101 -
 102
102 -
 103
103 -
 104
104 -
105
-
106
-
107
-
108
-
109
-
110
-
111
-
112
-
113
-
114
-
115
-
116
-
117
-
118
-
119
-
120
-
121
-
122
-
123
-
124
-
125
-
126
-
127
-
128
-
129
-
130
-
131
-
132
-
133
-
134
-
135
-
136
-
137
-
138
-
139
-
140
-
141
-
142
-
143
-
144
-
145
-
146
-
147
-
148
-
149
-
150
-
151
-
152
-
153
-
154
-
155
-
156
-
157
-
158
-
159
-
160
-
161
-
162
-
163
-
164
-
165
-
166
-
167
-
168
-
169
-
170
-
171
-
172
-
173
-
174
-
175
-
176
-
177
-
178
-
179
-
180
-
181
-
182
-
183
-
184
-
185
-
186
-
187
-
188
-
189
-
190
-
191
-
192
-
193
-
194
-
195
-
196
-
197
-
198
-
199
-
200
-
201
-
202
-
203
-
204
-
205
-
206
-
207
-
208
-
209
-
210
-
211
-
212
-
213
-
214
-
215
-
216
-
217
-
218
-
219
-
220
 |
 |

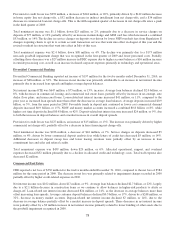
Provision for credit losses was $992 million, a decrease of $244 million, or 20%, primarily driven by a $142 million decrease
in home equity line net charge-offs, a $52 million decrease in indirect installment loan net charge-offs, and a $34 million
decrease in commercial loan net charge-offs. This is the fifth sequential quarter of decreases in net charge-offs since a peak
in the third quarter of 2009.
Total noninterest income was $1.1 billion, down $25 million, or 2%, primarily due to a decrease in service charges on
deposits of $77 million, or 12% partially offset by an increase in interchange and ATM card fees which increased a combined
$53 million, or 14%.The decline in service charges on deposits was driven by lower NSF/overdraft fees from Regulation E
changes requiring clients to opt in to certain account transaction services that went into effect in August of this year and the
revised overdraft fee structure that went into effect in July of this year.
Total noninterest expense was $2.4 billion, down $98 million, or 4%. The decline was primarily due to a $173 million
non-cash goodwill impairment charge that was recognized in the first quarter of 2009 and lower personnel costs. Partially
offsetting those decreases was a $27 million increase in FDIC expense due to higher account balances a $16 million increase
in outside processing cost, as well as an increase in shared corporate expenses primarily in technology and operational areas.
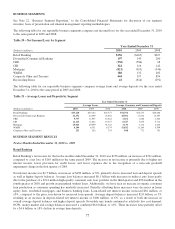
Diversified Commercial Banking
Diversified Commercial Banking reported net income of $197 million for the twelve months ended December 31, 2010, an
increase of $48 million, or 32%. The increase in net income was primarily attributable to an increase in net interest income
primarily due to increased loan spreads and higher average deposit balances.
Net interest income-FTE was $647 million, a $75 million, or 13%, increase. Average loan balances declined $2.0 billion, or
8%, with decreases in commercial, leasing, and commercial real estate loans, partially offset by increases in tax-exempt, auto
dealer floor plans, and nonaccrual loans. Loan-related net interest income increased $41 million, or 11%, compared to the
prior year as increased loan spreads more than offset the decrease in average loan balances. Average deposits increased $0.9
billion, or 5%, from the same period in 2009. Favorable trends in deposit mix continued as lower cost commercial demand
deposits increased $0.9 billion, or 15%, NOW and money market accounts increased a combined $0.8 billion, or 8%, while
higher cost time deposits declined $0.8 billion, or 42%. Deposit-related net interest income increased $24 million, or 9%, due
to both the increase in deposit balances and a modest increase in overall deposit spreads.
Provision for credit losses was $127 million, an increase of $15 million, or 13%. The increase was primarily driven by higher
commercial net charge-offs, partially offset by a decrease in lease financing net charge-offs.
Total noninterest income was $226 million, a decrease of $16 million, or 7%. Service charges on deposits decreased $5
million, or 4%, driven by lower commercial deposit analysis fees while letters of credit fees decreased $5 million, or 14%.
Additional decreases in deposit sweep fees and lower leasing revenues were partially offset by an increase in loan
commitment fees and sales and referral credits.
Total noninterest expense was $439 million, down $29 million, or 6%. Allocated operational, support, and overhead
expenses decreased $32 million primarily due to a decline in allocated credit and technology costs. Total staff expense also
decreased $2 million.
Commercial Real Estate
CRE reported a net loss of $330 million for the twelve months ended December 31, 2010, compared to the net loss of $584
million for the same period in 2009. The decrease in net loss was primarily related to impairment charges recorded in 2009
partially offset by higher credit-related expenses in 2010.
Net interest income was $162 million, down $17 million, or 9%. Average loan balances declined $2.7 billion, or 22%, largely
due to a $2.1 billion decrease in construction loans as we continue to allow balances in higher-risk products to attrite or
charge-off. Loan-related net interest income decreased $24 million, or 14%, as the decrease in average balances more than
offset increasing loan spreads. Average customer deposit balances declined $0.3 billion, or 17%, driven by a $248 million, or
32%, decrease in money market accounts. Deposit-related net interest income declined $7 million, or 14%, due to the
decrease in average balance partially offset by a modest increase in deposit spreads. These decreases in net interest income
were partially offset by a $9 million increase in net interest income primarily related to lower funding of other assets due to
the goodwill impairment recognized in 2009.
78