SunTrust 2010 Annual Report Download - page 48
Download and view the complete annual report
Please find page 48 of the 2010 SunTrust annual report below. You can navigate through the pages in the report by either clicking on the pages listed below, or by using the keyword search tool below to find specific information within the annual report.-
 1
1 -
2
-
3
-
4
-
5
-
6
-
7
-
8
-
9
-
10
-
11
-
12
-
13
-
14
-
15
-
16
-
17
-
18
-
19
-
20
-
21
-
22
-
23
-
24
-
25
-
26
-
27
-
28
-
29
-
30
-
31
-
32
-
33
-
34
-
35
-
36
-
37
-
 38
38 -
 39
39 -
 40
40 -
 41
41 -
 42
42 -
 43
43 -
 44
44 -
 45
45 -
 46
46 -
 47
47 -
 48
48 -
 49
49 -
 50
50 -
 51
51 -
 52
52 -
 53
53 -
 54
54 -
 55
55 -
 56
56 -
 57
57 -
 58
58 -
59
-
60
-
61
-
62
-
63
-
64
-
65
-
66
-
67
-
68
-
69
-
70
-
71
-
72
-
73
-
74
-
75
-
76
-
77
-
78
-
79
-
80
-
81
-
82
-
83
-
84
-
85
-
86
-
87
-
88
-
89
-
90
-
91
-
92
-
93
-
94
-
95
-
96
-
97
-
98
-
99
-
100
-
101
-
102
-
103
-
104
-
105
-
106
-
107
-
108
-
109
-
110
-
111
-
112
-
113
-
114
-
115
-
116
-
117
-
118
-
119
-
120
-
121
-
122
-
123
-
124
-
125
-
126
-
127
-
128
-
129
-
130
-
131
-
132
-
133
-
134
-
135
-
136
-
137
-
138
-
139
-
140
-
141
-
142
-
143
-
144
-
145
-
146
-
147
-
148
-
149
-
150
-
151
-
152
-
153
-
154
-
155
-
156
-
157
-
158
-
159
-
160
-
161
-
162
-
163
-
164
-
165
-
166
-
167
-
168
-
169
-
170
-
171
-
172
-
173
-
174
-
175
-
176
-
177
-
178
-
179
-
180
-
181
-
182
-
183
-
184
-
185
-
186
-
187
-
188
-
189
-
190
-
191
-
192
-
193
-
194
-
195
-
196
-
197
-
198
-
199
-
200
-
201
-
202
-
203
-
204
-
205
-
206
-
207
-
208
-
209
-
210
-
211
-
212
-
213
-
214
-
215
-
216
-
217
-
218
-
219
-
220
 |
 |

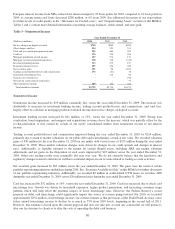
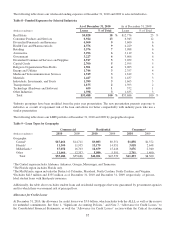
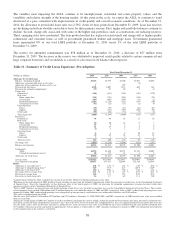
Table 4 - Noninterest Expense
Year Ended December 31
(Dollars in millions) 2010 2009 2008
Employee compensation $2,364 $2,258 $2,327
Employee benefits 457 542 434
Personnel expense 2,821 2,800 2,761
Other real estate expense 300 244 105
Credit and collection services 279 259 156
Operating losses 83 99 446
Mortgage reinsurance 27 115 180
Credit-related costs 689 717 887
Outside processing and software 638 579 493
Net occupancy expense 361 357 347
Regulatory assessments 265 302 55
Marketing and customer development 177 152 372
Equipment expense 174 172 203
Consulting and legal 84 57 59
Postage and delivery 83 84 90
Net loss on debt extinguishment 70 39 12
Communications 64 67 70
Other staff expense 55 51 70
Amortization of intangible assets 51 56 76
Operating supplies 47 41 44
Impairment of goodwill/intangible assets -751 45
Visa litigation -7 (33)
Merger expense --13
Other expense 332 330 315
Total noninterest expense $5,911 $6,562 $5,879
Noninterest Expense
Noninterest expense decreased by $651 million, or 10%, versus the year ended December 31, 2009. Included in noninterest
expense for the year ended December 31, 2009 was a $751 million non-cash goodwill impairment charge recognized in the
first quarter of 2009. Excluding the impact of the goodwill impairment charge, noninterest expense increased by $100
million, or approximately 2%, versus the year ended December 31, 2009. The impact of excluding the non-cash goodwill
impairment charge provides a more meaningful comparison to the results in the current year by removing this nonrecurring
item. The increase in 2010 expenses excluding the prior year goodwill impairment charge was reflective of our desire to
balance investments in the business with our expense discipline. Specifically, the increase in core noninterest expense was
primarily attributable to higher outside processing and software costs, increased marketing and customer development costs,
higher consulting and legal expenses, higher personnel expense, and increased net loss on debt extinguishment, partially
offset by a decline in regulatory expenses and credit-related costs.
Credit-related costs decreased by $28 million, or 4%, versus the year ended December 31, 2009. The decrease was due to
decline in mortgage reinsurance losses of $88 million, partially offset by an increase in other real estate expenses of $56
million. Mortgage reinsurance expenses relate to the activities of our mortgage reinsurance guaranty subsidiary, Twin Rivers,
whose loss exposure arises from third party mortgage insurers transferring a portion of their first loss exposure when losses
by mortgage origination year exceed certain thresholds. Since the first quarter of 2009, our exposure to reinsurance losses has
been limited to incremental insurance premium contributions, which has caused the steady decline in this expense as we
ceased writing new contracts in 2009. Other real estate expense increased compared to 2009 primarily due to an increase in
net losses on the sale of OREO properties.
Regulatory assessments decreased by $37 million, or 12%, compared to the year ended December 31, 2009, attributable to
the decline in FDIC insurance premiums, primarily due to the payment of the special assessment levied on all banks during
the second quarter of 2009, offset by higher deposit balances in 2010. With respect to the current FDIC deposit insurance
32