SunTrust 2010 Annual Report Download - page 64
Download and view the complete annual report
Please find page 64 of the 2010 SunTrust annual report below. You can navigate through the pages in the report by either clicking on the pages listed below, or by using the keyword search tool below to find specific information within the annual report.-
 1
1 -
2
-
3
-
4
-
5
-
6
-
7
-
8
-
9
-
10
-
11
-
12
-
13
-
14
-
15
-
16
-
17
-
18
-
19
-
20
-
21
-
22
-
23
-
24
-
25
-
26
-
27
-
28
-
29
-
30
-
31
-
32
-
33
-
34
-
35
-
36
-
37
-
38
-
39
-
40
-
41
-
42
-
43
-
44
-
45
-
46
-
47
-
48
-
49
-
50
-
51
-
52
-
53
-
 54
54 -
 55
55 -
 56
56 -
 57
57 -
 58
58 -
 59
59 -
 60
60 -
 61
61 -
 62
62 -
 63
63 -
 64
64 -
 65
65 -
 66
66 -
 67
67 -
 68
68 -
 69
69 -
 70
70 -
 71
71 -
 72
72 -
 73
73 -
 74
74 -
75
-
76
-
77
-
78
-
79
-
80
-
81
-
82
-
83
-
84
-
85
-
86
-
87
-
88
-
89
-
90
-
91
-
92
-
93
-
94
-
95
-
96
-
97
-
98
-
99
-
100
-
101
-
102
-
103
-
104
-
105
-
106
-
107
-
108
-
109
-
110
-
111
-
112
-
113
-
114
-
115
-
116
-
117
-
118
-
119
-
120
-
121
-
122
-
123
-
124
-
125
-
126
-
127
-
128
-
129
-
130
-
131
-
132
-
133
-
134
-
135
-
136
-
137
-
138
-
139
-
140
-
141
-
142
-
143
-
144
-
145
-
146
-
147
-
148
-
149
-
150
-
151
-
152
-
153
-
154
-
155
-
156
-
157
-
158
-
159
-
160
-
161
-
162
-
163
-
164
-
165
-
166
-
167
-
168
-
169
-
170
-
171
-
172
-
173
-
174
-
175
-
176
-
177
-
178
-
179
-
180
-
181
-
182
-
183
-
184
-
185
-
186
-
187
-
188
-
189
-
190
-
191
-
192
-
193
-
194
-
195
-
196
-
197
-
198
-
199
-
200
-
201
-
202
-
203
-
204
-
205
-
206
-
207
-
208
-
209
-
210
-
211
-
212
-
213
-
214
-
215
-
216
-
217
-
218
-
219
-
220
 |
 |

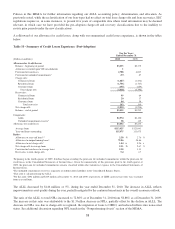
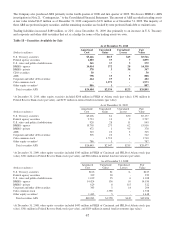
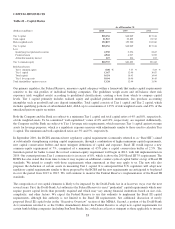
Table 19 – Maturity Distribution of Securities Available for Sale
As of December 31, 2010
(Dollars in millions)
1 Year
or Less
1-5
Years
5-10
Years
After 10
Years Total
Distribution of Maturities:
Amortized Cost
U.S. Treasury securities $1 $3,390 $2,055 $- $5,446
Federal agency securities 62 1,608 184 29 1,883
U.S. states and political subdivisions 114 290 63 98 565
RMBS - agency 459 12,738 781 36 14,014
RMBS - private 35 188 155 - 378
CDO securities - 50 - - 50
ABS 290 504 4 - 798
Corporate and other debt securities 9 307 123 25 464
Total debt securities $970 $19,075 $3,365 $188 $23,598
Fair Value
U.S. Treasury securities $1 $3,505 $2,010 $- $5,516
Federal agency securities 63 1,613 190 29 1,895
U.S. states and political subdivisions 116 303 64 96 579
RMBS - agency 470 13,039 810 39 14,358
RMBS - private 32 175 140 - 347
CDO securities - 50 - - 50
ABS 297 508 3 - 808
Corporate and other debt securities 9 314 135 24 482
Total debt securities $988 $19,507 $3,352 $188 $24,035
Weighted average yield (FTE):
U.S. Treasury securities 0.74 % 2.44 % 2.92 % - % 2.62 %
Federal agency securities 3.41 1.92 4.14 4.02 2.22
U.S. states and political subdivisions 6.87 6.09 5.93 5.14 6.11
RMBS - agency 2.23 3.20 4.56 5.38 3.23
RMBS - private 1.70 7.59 7.54 4.35 7.03
CDO securities - 3.86 - - 3.86
ABS 1.73 2.47 13.43 - 2.15
Corporate and other debt securities 4.82 2.09 5.74 1.13 3.15
Total debt securities 2.84 % 3.01 % 3.76 % 4.91 % 3.10 %
Securities Available for Sale
The securities AFS portfolio is managed as part of the overall asset and liability management process to optimize income and
portfolio value over an entire interest rate cycle while mitigating the associated risks. The size of the securities portfolio, at
fair value, was $26.9 billion as of December 31, 2010, a decrease of $1.6 billion, or 6%, versus December 31, 2009. Changes
in the size and composition of the portfolio during the year reflect our efforts to maintain a high quality portfolio and manage
our interest rate risk profile. These changes included increasing the size and extending the duration of the U.S. Treasury
position, decreasing the agency MBS positions, reducing federal agency securities, reducing the municipal position by selling
lower rated securities, and purchasing high quality ABS backed by newly-originated consumer automobile loans. For
additional information on composition and valuation assumptions related to securities AFS, see the “Trading Assets and
Securities Available for Sale” section of Note 20, “Fair Value Election and Measurement,” to the Consolidated Financial
Statements.
At December 31, 2010, the carrying value of securities AFS reflected $2.4 billion in net unrealized gains, which were
comprised of a $2.0 billion unrealized gain from our remaining 30 million shares of Coke common stock and a $438 million
net unrealized gain on the remainder of the portfolio. At December 31, 2009, the carrying value of securities AFS reflected
$1.8 billion in net unrealized gains, which were comprised of a $1.7 billion unrealized gain from our remaining 30 million
shares of Coke common stock and a $122 million net unrealized gain on the remainder of the portfolio. During the years
ended December 31, 2010 and 2009, we recorded $193 million and $118 million in net realized gains from the sale of
securities AFS as a result of the aforementioned repositioning activities.
48