SunTrust 2010 Annual Report Download - page 203
Download and view the complete annual report
Please find page 203 of the 2010 SunTrust annual report below. You can navigate through the pages in the report by either clicking on the pages listed below, or by using the keyword search tool below to find specific information within the annual report.-
 1
1 -
2
-
3
-
4
-
5
-
6
-
7
-
8
-
9
-
10
-
11
-
12
-
13
-
14
-
15
-
16
-
17
-
18
-
19
-
20
-
21
-
22
-
23
-
24
-
25
-
26
-
27
-
28
-
29
-
30
-
31
-
32
-
33
-
34
-
35
-
36
-
37
-
38
-
39
-
40
-
41
-
42
-
43
-
44
-
45
-
46
-
47
-
48
-
49
-
50
-
51
-
52
-
53
-
54
-
55
-
56
-
57
-
58
-
59
-
60
-
61
-
62
-
63
-
64
-
65
-
66
-
67
-
68
-
69
-
70
-
71
-
72
-
73
-
74
-
75
-
76
-
77
-
78
-
79
-
80
-
81
-
82
-
83
-
84
-
85
-
86
-
87
-
88
-
89
-
90
-
91
-
92
-
93
-
94
-
95
-
96
-
97
-
98
-
99
-
100
-
101
-
102
-
103
-
104
-
105
-
106
-
107
-
108
-
109
-
110
-
111
-
112
-
113
-
114
-
115
-
116
-
117
-
118
-
119
-
120
-
121
-
122
-
123
-
124
-
125
-
126
-
127
-
128
-
129
-
130
-
131
-
132
-
133
-
134
-
135
-
136
-
137
-
138
-
139
-
140
-
141
-
142
-
143
-
144
-
145
-
146
-
147
-
148
-
149
-
150
-
151
-
152
-
153
-
154
-
155
-
156
-
157
-
158
-
159
-
160
-
161
-
162
-
163
-
164
-
165
-
166
-
167
-
168
-
169
-
170
-
171
-
172
-
173
-
174
-
175
-
176
-
177
-
178
-
179
-
180
-
181
-
182
-
183
-
184
-
185
-
186
-
187
-
188
-
189
-
190
-
191
-
192
-
 193
193 -
 194
194 -
 195
195 -
 196
196 -
 197
197 -
 198
198 -
 199
199 -
 200
200 -
 201
201 -
 202
202 -
 203
203 -
 204
204 -
 205
205 -
 206
206 -
 207
207 -
 208
208 -
 209
209 -
 210
210 -
 211
211 -
 212
212 -
 213
213 -
214
-
215
-
216
-
217
-
218
-
219
-
220
 |
 |

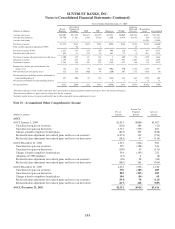
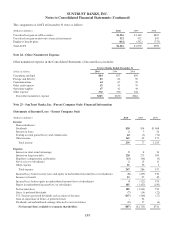
SUNTRUST BANKS, INC.
Notes to Consolidated Financial Statements (Continued)
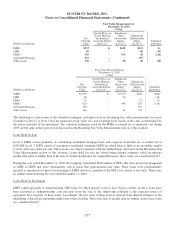
The application and development of management reporting methodologies is a dynamic process and is subject to periodic
enhancements. The implementation of these enhancements to the internal management reporting methodology may
materially affect the results disclosed for each segment with no impact on consolidated results. Whenever significant changes
to management reporting methodologies take place, the impact of these changes is quantified and prior period information is
reclassified wherever practicable.
Twelve Months Ended December 31, 2010
(Dollars in millions)
Retail
Banking
Diversified
Commercial
Banking CRE CIB Mortgage W&IM
Corporate
Other and
Treasury
Reconciling
Items Consolidated
Average total assets $38,911 $24,662 $10,796 $20,387 $34,793 $9,177 $32,827 $822 $172,375
Average total liabilities 75,152 20,770 1,676 16,040 4,031 12,496 19,479 (103) 149,541
Average total equity -------22,834 22,834
Net interest income $2,540 $542 $162 $379 $427 $447 $473 ($116) $4,854
Fully taxable-equivalent adjustment (FTE) - 105 - 1 - - 10 - 116
Net interest income (FTE)12,540 647 162 380 427 447 483 (116) 4,970
Provision for credit losses2992 127 442 50 1,183 61 - (204) 2,651
Net interest income after provision for credit losses 1,548 520 (280) 330 (756) 386 483 88 2,319
Noninterest income 1,127 226 88 670 521 822 307 (32) 3,729
Noninterest expense 2,433 439 471 490 1,089 916 102 (29) 5,911
Income/(loss) before provision/(benefit) for
income taxes 242 307 (663) 510 (1,324) 292 688 85 137
Provision/(benefit) for income taxes386 110 (333) 188 (504) 105 235 44 (69)
Net income/(loss) including income attributable to
noncontrolling interest 156 197 (330) 322 (820) 187 453 41 206
Net income attributable to noncontrolling interest ----179-17
Net income/(loss) $156 $197 ($330) $322 ($821) $180 $444 $41 $189
Twelve Months Ended December 31, 2009
(Dollars in millions)
Retail
Banking
Diversified
Commercial
Banking CRE CIB Mortgage W&IM
Corporate
Other and
Treasury
Reconciling
Items Consolidated
Average total assets $39,245 $26,769 $13,630 $21,414 $37,296 $9,136 $26,713 $1,239 $175,442
Average total liabilities 73,130 19,937 2,389 12,400 3,863 11,511 29,779 147 153,156
Average total equity -------22,286 22,286
Net interest income $2,351 $465 $179 $302 $499 $399 $428 ($157) $4,466
Fully taxable-equivalent adjustment (FTE) - 107 - 2 - - 14 - 123
Net interest income (FTE)12,351 572 179 304 499 399 442 (157) 4,589
Provision for credit losses21,236 112 435 248 1,125 79 2 827 4,064
Net interest income after provision for credit losses 1,115 460 (256) 56 (626) 320 440 (984) 525
Noninterest income 1,152 242 94 611 686 753 203 (31) 3,710
Noninterest expense 2,531 468 721 481 1,418 861 112 (30) 6,562
Income/(loss) before provision/(benefit) for
income taxes (264) 234 (883) 186 (1,358) 212 531 (985) (2,327)
Provision/(benefit) for income taxes3(99) 85 (299) 70 (366) 80 125 (371) (775)
Net income/(loss) including income attributable to
noncontrolling interest (165) 149 (584) 116 (992) 132 406 (614) (1,552)
Net income attributable to noncontrolling interest ----3-9-12
Net income/(loss) ($165) $149 ($584) $116 ($995) $132 $397 ($614) ($1,564)
187