SunTrust 2010 Annual Report Download - page 102
Download and view the complete annual report
Please find page 102 of the 2010 SunTrust annual report below. You can navigate through the pages in the report by either clicking on the pages listed below, or by using the keyword search tool below to find specific information within the annual report.-
 1
1 -
2
-
3
-
4
-
5
-
6
-
7
-
8
-
9
-
10
-
11
-
12
-
13
-
14
-
15
-
16
-
17
-
18
-
19
-
20
-
21
-
22
-
23
-
24
-
25
-
26
-
27
-
28
-
29
-
30
-
31
-
32
-
33
-
34
-
35
-
36
-
37
-
38
-
39
-
40
-
41
-
42
-
43
-
44
-
45
-
46
-
47
-
48
-
49
-
50
-
51
-
52
-
53
-
54
-
55
-
56
-
57
-
58
-
59
-
60
-
61
-
62
-
63
-
64
-
65
-
66
-
67
-
68
-
69
-
70
-
71
-
72
-
73
-
74
-
75
-
76
-
77
-
78
-
79
-
80
-
81
-
82
-
83
-
84
-
85
-
86
-
87
-
88
-
89
-
90
-
91
-
 92
92 -
 93
93 -
 94
94 -
 95
95 -
 96
96 -
 97
97 -
 98
98 -
 99
99 -
 100
100 -
 101
101 -
 102
102 -
 103
103 -
 104
104 -
 105
105 -
 106
106 -
 107
107 -
 108
108 -
 109
109 -
 110
110 -
 111
111 -
 112
112 -
113
-
114
-
115
-
116
-
117
-
118
-
119
-
120
-
121
-
122
-
123
-
124
-
125
-
126
-
127
-
128
-
129
-
130
-
131
-
132
-
133
-
134
-
135
-
136
-
137
-
138
-
139
-
140
-
141
-
142
-
143
-
144
-
145
-
146
-
147
-
148
-
149
-
150
-
151
-
152
-
153
-
154
-
155
-
156
-
157
-
158
-
159
-
160
-
161
-
162
-
163
-
164
-
165
-
166
-
167
-
168
-
169
-
170
-
171
-
172
-
173
-
174
-
175
-
176
-
177
-
178
-
179
-
180
-
181
-
182
-
183
-
184
-
185
-
186
-
187
-
188
-
189
-
190
-
191
-
192
-
193
-
194
-
195
-
196
-
197
-
198
-
199
-
200
-
201
-
202
-
203
-
204
-
205
-
206
-
207
-
208
-
209
-
210
-
211
-
212
-
213
-
214
-
215
-
216
-
217
-
218
-
219
-
220
 |
 |

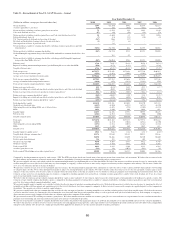
Table 32 – Reconcilement of Non-U.S. GAAP Measures – Annual
Year Ended December 31
(Dollars in millions, except per share and other data) 2010 2009 2008 2007 2006
Net income/(loss) $189 ($1,564) $796 $1,634 $2,117
securities (gains)/losses, net of tax (118) (61) (665) (151) 32
Net income/(loss) excluding securities (gains)/losses, net of tax 71 (1,625) 131 1,483 2,149
Coke stock dividend, net of tax (47) (44) (50) (54) (53)
Net income/(loss) excluding securities (gains)/losses and Coke stock dividend, net of tax 24 (1,669) 81 1,429 2,096
Preferred dividends, Series A (7) (14) (22) (30) (8)
U.S. Treasury preferred dividends and accretion of discount (267) (266) (27) - -
Dividends and undistributed earnings allocated to unvested shares (2) 17 (6) - -
Gain on purchase of Series A prefereed stock -94---
Net income/(loss) available to common shareholders excluding securities (gains)/losses and Coke
stock dividend ($252) ($1,838) $26 $1,399 $2,088
Net income/(loss) available to common shareholders ($87) ($1,733) $741 $1,593 $2,098
Goodwill/intangible impairment charges other than MSRs attributable to common shareholders, after
tax -715 27 - -
Net income/(loss) available to common shareholders excluding goodwill/intangible impairment
charges other than MSRs, after tax 8($87) ($1,018) $768 $1,593 $2,098
Efficiency ratio 167.94 % 79.07 % 63.83 % 63.28 % 59.23 %
Impact of excluding amortization/impairment of goodwill/intangible assets other than MSRs (0.58) (9.72) (1.32) (1.17) (1.26)
Tangible efficiency ratio 267.36 % 69.35 % 62.51 % 62.11 % 57.97 %
Total average assets $172,375 $175,442 $175,848 $177,796 $180,315
Average net unrealized securities gains (2,231) (1,612) (1,909) (2,301) (1,620)
Average assets less net unrealized securities gains $170,144 $173,830 $173,939 $175,495 $178,695
Total average common shareholders’ equity $17,905 $17,219 $17,646 $17,428 $17,546
Average accumulated other comprehensive income (1,420) (692) (1,221) (1,143) (976)
Total average realized common shareholders’ equity $16,485 $16,527 $16,425 $16,285 $16,570
Return on average total assets 0.11 % (0.89) % 0.45 % 0.92 % 1.17 %
Impact of excluding net realized and unrealized securities (gains)/losses and Coke stock dividend (0.10) (0.07) (0.40) (0.11) -
Return on average total assets less net unrealized securities (gains)/losses 30.01 % (0.96) % 0.05 % 0.81 % 1.17 %
Return on average common shareholders’ equity (0.49) % (10.07) % 4.20 % 9.14 % 11.95 %
Impact of excluding net realized and unrealized securities (gains)/losses and Coke stock dividend (1.04) (1.05) (4.04) (0.62) 0.58
Return on average realized common shareholders’ equity 4(1.53) % (11.12) % 0.16 % 8.52 % 12.53 %
Total shareholders’ equity $23,130 $22,531 $22,501 $18,170 $17,932
Goodwill, net of deferred taxes (6,189) (6,204) (6,941) (6,921) (6,890)
Other intangible assets including MSRs, net of deferred taxes (1,545) (1,671) (978) (1,309) (1,182)
MSRs 1,439 1,540 810 1,049 811
Tangible equity 16,835 16,196 15,392 10,989 10,671
Preferred stock (4,942) (4,917) (5,222) (500) (500)
Tangible common equity $11,893 $11,279 $10,170 $10,489 $10,171
Total assets $172,874 $174,165 $189,138 $179,574 $182,162
Goodwill (6,323) (6,319) (7,044) (6,921) (6,890)
Other intangible assets including MSRs (1,571) (1,711) (1,035) (1,363) (1,182)
MSRs 1,439 1,540 810 1,049 811
Tangible assets $166,419 $167,675 $181,869 $172,339 $174,901
Tangible equity to tangible assets 510.12 % 9.66 % 8.46 % 6.38 % 6.10 %
Tangible book value per common share 6$23.76 $22.60 $28.69 $30.11 $28.66
Net interest income $4,854 $4,466 $4,620 $4,720 $4,660
Taxable-equivalent adjustment 116 123 117 102 88
Net interest income-FTE 4,970 4,589 4,737 4,822 4,748
Noninterest income 3,729 3,710 4,473 3,429 3,468
Total revenue-FTE 8,699 8,299 9,210 8,251 8,216
securities (gains)/losses, net (191) (98) (1,073) (243) 50
Total revenue-FTE excluding net securities (gains)/losses 7$8,508 $8,201 $8,137 $8,008 $8,266
1Computed by dividing noninterest expense by total revenue - FTE. The FTE basis adjusts for the tax-favored status of net interest income from certain loans and investments. We believe this measure to be the
preferred industry measurement of net interest income and it enhances comparability of net interest income arising from taxable and tax-exempt sources.
2We present a tangible efficiency ratio which excludes the amortization/impairment of goodwill/intangible assets other than MSRs. We believe this measure is useful to investors because, by removing the effect
of these intangible asset costs (the level of which may vary from company to company), it allows investors to more easily compare our efficiency to other companies in the industry. This measure is utilized by
us to assess our efficiency and that of our lines of business.
3We present a return on average assets less net unrealized gains on securities. The foregoing numbers primarily reflect adjustments to remove the effects of the securities portfolio which includes our ownership
of common shares of Coke. We use this information internally to gauge our actual performance in the industry. We believe that the return on average assets less the net unrealized securities gains is more
indicative of the our return on assets because it more accurately reflects the return on the assets that are related to our core businesses which are primarily client relationship and client transaction driven. The
return on average assets less net unrealized gains on securities is computed by dividing annualized net income/(loss), excluding securities (gains)/losses and the Coke stock dividend, net of tax, by average
assets less net unrealized securities (gains)/losses.
4We believe that the return on average realized common shareholders’ equity is more indicative of our return on equity because the excluded equity relates primarily to the holding of a specific security. The
return on average realized common shareholders’ equity is computed by dividing annualized net income/(loss) available to common shareholders, excluding securities (gains)/losses and Coke stock dividend,
net of tax, by average realized common shareholders’ equity.
5We present a tangible equity to tangible assets ratio that excludes the after-tax impact of purchase accounting intangible assets. We believe this measure is useful to investors because, by removing the effect of
intangible assets that result from merger and acquisition activity (the level of which may vary from company to company), it allows investors to more easily compare our capital adequacy to other companies in
the industry. This measure is used by us to analyze capital adequacy.
6We present a tangible book value per common share that excludes the after-tax impact of purchase accounting intangible assets and also excludes preferred stock from tangible equity. We believe this measure
is useful to investors because, by removing the effect of intangible assets that result from merger and acquisition activity as well as preferred stock (the level of which may vary from company to company), it
allows investors to more easily compare our book value on common stock to other companies in the industry.
7We present total revenue- FTE excluding net securities (gains)/losses. We believe noninterest income without net securities (gains)/losses is more indicative of our performance because it isolates income that is
primarily client relationship and client transaction driven and is more indicative of normalized operations.
8We present net income/(loss) available to common shareholders that excludes the portion of the impairment charges on goodwill and intangible assets other than MSRs allocated to the common shareholders.
We believe this measure is useful to investors, because removing the non-cash impairment charge provides a more representative view of normalized operations and the measure also allows better comparability
with peers in the industry who also provide a similar presentation when applicable. In addition, we use this measure internally to analyze performance.
86