SunTrust 2010 Annual Report Download - page 10
Download and view the complete annual report
Please find page 10 of the 2010 SunTrust annual report below. You can navigate through the pages in the report by either clicking on the pages listed below, or by using the keyword search tool below to find specific information within the annual report.-
 1
1 -
 2
2 -
 3
3 -
 4
4 -
 5
5 -
 6
6 -
 7
7 -
 8
8 -
 9
9 -
 10
10 -
 11
11 -
 12
12 -
 13
13 -
 14
14 -
 15
15 -
 16
16 -
 17
17 -
 18
18 -
 19
19 -
 20
20 -
 21
21 -
22
-
23
-
24
-
25
-
26
-
27
-
28
-
29
-
30
-
31
-
32
-
33
-
34
-
35
-
36
-
37
-
38
-
39
-
40
-
41
-
42
-
43
-
44
-
45
-
46
-
47
-
48
-
49
-
50
-
51
-
52
-
53
-
54
-
55
-
56
-
57
-
58
-
59
-
60
-
61
-
62
-
63
-
64
-
65
-
66
-
67
-
68
-
69
-
70
-
71
-
72
-
73
-
74
-
75
-
76
-
77
-
78
-
79
-
80
-
81
-
82
-
83
-
84
-
85
-
86
-
87
-
88
-
89
-
90
-
91
-
92
-
93
-
94
-
95
-
96
-
97
-
98
-
99
-
100
-
101
-
102
-
103
-
104
-
105
-
106
-
107
-
108
-
109
-
110
-
111
-
112
-
113
-
114
-
115
-
116
-
117
-
118
-
119
-
120
-
121
-
122
-
123
-
124
-
125
-
126
-
127
-
128
-
129
-
130
-
131
-
132
-
133
-
134
-
135
-
136
-
137
-
138
-
139
-
140
-
141
-
142
-
143
-
144
-
145
-
146
-
147
-
148
-
149
-
150
-
151
-
152
-
153
-
154
-
155
-
156
-
157
-
158
-
159
-
160
-
161
-
162
-
163
-
164
-
165
-
166
-
167
-
168
-
169
-
170
-
171
-
172
-
173
-
174
-
175
-
176
-
177
-
178
-
179
-
180
-
181
-
182
-
183
-
184
-
185
-
186
-
187
-
188
-
189
-
190
-
191
-
192
-
193
-
194
-
195
-
196
-
197
-
198
-
199
-
200
-
201
-
202
-
203
-
204
-
205
-
206
-
207
-
208
-
209
-
210
-
211
-
212
-
213
-
214
-
215
-
216
-
217
-
218
-
219
-
220
 |
 |

8
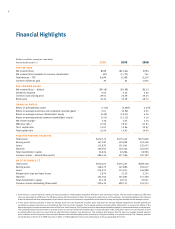
Financial Highlights
(Dollars in millions, except per share data)
Year ended December 31 2010 2009 2008
for the year
Net income/(loss) $189 ($1,564) $796
Net income/(loss) available to common shareholders (87) (1,733) 741
Total revenue — FTE 1 8,699 8,299 9,210
Common dividends paid 20 83 1,004
per common share
Net income/(loss) — diluted ($0.18) ($3.98) $2.12
Dividends declared 0.04 0.22 2.85
Common stock closing price 29.51 20.29 29.54
Book value 36.34 35.29 48.74
financial ratios
Return on average total assets 0.11% (0.89)% 0.45%
Return on average assets less net unrealized securities gains 2 0.01 (0.96) 0.05
Return on average common shareholders’ equity (0.49) (10.07) 4.20
Return on average realized common shareholders’ equity 2 (1.53) (11.12) 0.16
Net interest margin 1 3.38 3.04 3.10
Efficiency ratio 1 67.94 79.07 63.83
Tier 1 capital ratio 13.67 12.96 10.87
Total capital ratio 16.54 16.43 14.04
selected average balances
Total assets $172,375 $175,442 $175,848
Earning assets 147,187 150,908 152,749
Loans 113,925 121,041 125,433
Deposits 120,045 119,246 116,076
Total shareholders’ equity 22,834 22,286 18,596
Common shares — diluted (thousands) 498,744 437,486 350,183
as of december 31
Total assets $172,874 $174,165 $189,138
Earning assets 148,473 147,896 156,017
Loans 115,975 113,675 126,998
Allowance for loan and lease losses 2,974 3,120 2,351
Deposits 123,044 121,863 113,329
Total shareholders’ equity 23,130 22,531 22,501
Common shares outstanding (thousands) 500,436 499,157 354,515
x
1 Total revenue is comprised of net interest income presented on a fully-taxable equivalent (FTE) basis and noninterest income. The net interest margin and efficiency
ratios are presented on a FTE basis. The FTE basis adjusts for the tax-favored status of income from certain loans and investments. The Company believes this measure
to be the preferred industry measurement of net interest income and it enhances comparability of net interest income arising from taxable and tax-exempt sources.
2 In this report, SunTrust presents a return on average assets less net unrealized securities gains and return on average realized equity which exclude realized and
unrealized securities gains/losses and dividends from The Coca-Cola Company. The foregoing numbers primarily reflect adjustments to remove the effects of the
ownership by the Company of common shares of The Coca-Cola Company. The Company uses this information internally to gauge its actual performance in the industry.
The Company believes that the return on average assets less the net unrealized securities gains is more indicative of the Company’s return on assets because it more
accurately reflects the return on assets that are related to the Company’s core businesses. The Company also believes that the return on average realized equity is
more indicative of the Company’s return on equity because the excluded equity relates primarily to a long-term holding of a specific security. The Company provides
reconcilements of all non-U.S. GAAP measures in Table 32 of Management’s Discussion and Analysis in the accompanying Form 10-K.