SunTrust 2010 Annual Report Download - page 44
Download and view the complete annual report
Please find page 44 of the 2010 SunTrust annual report below. You can navigate through the pages in the report by either clicking on the pages listed below, or by using the keyword search tool below to find specific information within the annual report.
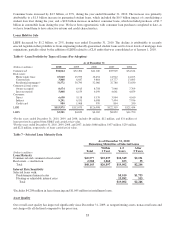
Table 2 - Analysis of Changes in Net Interest Income 1
2010 Compared to 2009
Increase (Decrease) Due to
2009 Compared to 2008 Increase
(Decrease) Due to
(Dollars in millions on a taxable-equivalent basis) Volume Rate Net Volume Rate Net
Interest Income
Loans:
Real estate 1-4 family ($31) ($138) ($169) ($138) ($144) ($282)
Real estate construction (93) 21 (72) (205) (173) (378)
Real estate home equity lines (25) 4 (21) 24 (298) (274)
Real estate commercial (40) (6) (46) 83 (233) (150)
Commercial - FTE2(193) 201 8 (89) (181) (270)
Credit card 691553439
Consumer - direct 30 14 44 29 (76) (47)
Consumer - indirect 56 (51) 5 (42) - (42)
Nonaccrual (2) 5 3 17 (6) 11
Securities available for sale:
Taxable 217 (222) (5) 324 (265) 59
Tax-exempt 2(12) (1) (13) (2) (6) (8)
Funds sold and securities purchased under
agreements to resell 1 (2) (1) (7) (16) (23)
Loans held for sale (81) (15) (96) 7 (64) (57)
Interest-bearing deposits ---- (1) (1)
Interest earning trading assets (19) (7) (26) (125) (64) (189)
Total interest income (186) (188) (374) (119) (1,493) (1,612)
Interest Expense
NOW accounts 4 (45) (41) 27 (181) (154)
Money market accounts 61 (148) (87) 89 (295) (206)
Savings 1 (2) (1) - (6) (6)
Consumer time (63) (149) (212) (2) (158) (160)
Other time (97) (97) (194) 32 (128) (96)
Brokered deposits (108) 64 (44) (150) (87) (237)
Foreign deposits ---(38) (40) (78)
Funds purchased (1) - (1) (14) (34) (48)
Securities sold under agreements to repurchase - (1) (1) (27) (48) (75)
Interest-bearing trading liabilities 13 (3) 10 (12) 5 (7)
Other short-term borrowings 1 (3) (2) (6) (35) (41)
Long-term debt (147) (35) (182) (124) (232) (356)
Total interest expense (336) (419) (755) (225) (1,239) (1,464)
Net change in net interest income $150 $231 $381 $106 ($254) ($148)
1Changes in net interest income are attributed to either changes in average balances (volume change) or changes in average rates (rate
change) for earning assets and sources of funds on which interest is received or paid. Volume change is calculated as change in volume times
the previous rate, while rate change is change in rate times the previous volume. The rate/volume change, change in rate times change in
volume, is allocated between volume change and rate change at the ratio each component bears to the absolute value of their total.
2Interest income includes the effects of the taxable-equivalent adjustments to increase tax-exempt interest income to a taxable-equivalent
basis.
Net Interest Income/Margin
Net interest income, on an FTE basis, was $5.0 billion during 2010, an increase of $381 million, or 8%, from 2009. This
increase was driven mainly by a continued positive trend in net interest margin, which increased 34 basis points to 3.38% in
2010 from 3.04% in 2009. Earning asset yields declined 14 basis points compared to 2009 from 4.53% to 4.39%, but the cost
of interest-bearing liabilities decreased 56 basis points over the same period. The biggest contributors to the net interest
margin increase were growth in low cost deposits, lower rates paid on time deposits, and a reduction in higher-cost long-term
debt coupled with a strong focus on loan pricing and higher commercial loan yields due to our commercial loan swap
position. These favorable margin contributors were partially offset by a reduction in residential mortgage loan yields and an
increase in lower-yielding securities.
We currently expect margin to be relatively stable in the near-term. Risks to this expectation include the potential impacts of
a prolonged low rate environment, yield curve flattening, a shift in deposit mix and volume, and loan pricing, while
opportunities include continued deposit re-pricing, further steepening of the yield curve, and lower nonperforming assets. As
28


