SunTrust 2010 Annual Report Download - page 154
Download and view the complete annual report
Please find page 154 of the 2010 SunTrust annual report below. You can navigate through the pages in the report by either clicking on the pages listed below, or by using the keyword search tool below to find specific information within the annual report.-
 1
1 -
2
-
3
-
4
-
5
-
6
-
7
-
8
-
9
-
10
-
11
-
12
-
13
-
14
-
15
-
16
-
17
-
18
-
19
-
20
-
21
-
22
-
23
-
24
-
25
-
26
-
27
-
28
-
29
-
30
-
31
-
32
-
33
-
34
-
35
-
36
-
37
-
38
-
39
-
40
-
41
-
42
-
43
-
44
-
45
-
46
-
47
-
48
-
49
-
50
-
51
-
52
-
53
-
54
-
55
-
56
-
57
-
58
-
59
-
60
-
61
-
62
-
63
-
64
-
65
-
66
-
67
-
68
-
69
-
70
-
71
-
72
-
73
-
74
-
75
-
76
-
77
-
78
-
79
-
80
-
81
-
82
-
83
-
84
-
85
-
86
-
87
-
88
-
89
-
90
-
91
-
92
-
93
-
94
-
95
-
96
-
97
-
98
-
99
-
100
-
101
-
102
-
103
-
104
-
105
-
106
-
107
-
108
-
109
-
110
-
111
-
112
-
113
-
114
-
115
-
116
-
117
-
118
-
119
-
120
-
121
-
122
-
123
-
124
-
125
-
126
-
127
-
128
-
129
-
130
-
131
-
132
-
133
-
134
-
135
-
136
-
137
-
138
-
139
-
140
-
141
-
142
-
143
-
 144
144 -
 145
145 -
 146
146 -
 147
147 -
 148
148 -
 149
149 -
 150
150 -
 151
151 -
 152
152 -
 153
153 -
 154
154 -
 155
155 -
 156
156 -
 157
157 -
 158
158 -
 159
159 -
 160
160 -
 161
161 -
 162
162 -
 163
163 -
 164
164 -
165
-
166
-
167
-
168
-
169
-
170
-
171
-
172
-
173
-
174
-
175
-
176
-
177
-
178
-
179
-
180
-
181
-
182
-
183
-
184
-
185
-
186
-
187
-
188
-
189
-
190
-
191
-
192
-
193
-
194
-
195
-
196
-
197
-
198
-
199
-
200
-
201
-
202
-
203
-
204
-
205
-
206
-
207
-
208
-
209
-
210
-
211
-
212
-
213
-
214
-
215
-
216
-
217
-
218
-
219
-
220
 |
 |

SUNTRUST BANKS, INC.
Notes to Consolidated Financial Statements (Continued)
Shares of restricted stock may be granted to employees and directors and typically cliff vest after three years. Restricted
stock grants may be subject to one or more criteria, including employment, performance or other conditions as established by
the Committee at the time of grant. Any shares of restricted stock that are forfeited will again become available for issuance
under the Stock Plan. An employee or director has the right to vote the shares of restricted stock after grant unless and until
they are forfeited. Compensation cost for restricted stock is equal to the fair market value of the shares at the date of the
award and is amortized to compensation expense over the vesting period. Dividends are paid on awarded but unvested
restricted stock.
The fair value of each stock option award is estimated on the date of grant using a Black-Scholes valuation model. Through
2008, the expected volatility was based on the historical volatility of the Company’s stock. Beginning in 2009, SunTrust
moved to implied volatility. The expected term represents the period of time that stock options granted are expected to be
outstanding and is derived from historical data which is used to evaluate patterns such as stock option exercise and employee
termination. The expected dividend yield was based on recent dividend history through 2008; however, in 2009 the Company
began using the current rate to calculate the yield. The risk-free interest rate is derived from the U.S. Treasury yield curve in
effect at the time of grant based on the expected life of the option.
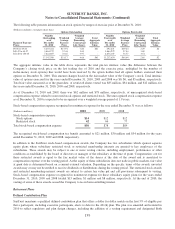
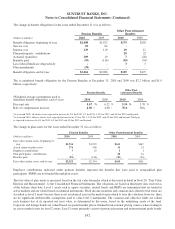
The weighted average fair values of options granted during 2010, 2009 and 2008 were $12.78, $5.13 and $7.63, respectively.
The fair value of each option grant is estimated on the date of grant using the Black-Scholes option pricing model with the
following assumptions:
2010 2009 2008
Dividend yield 0.17% 4.16% 5.62%
Expected stock price volatility 56.09 83.17 25.73
Risk-free interest rate (weighted average) 2.80 1.94 2.63
Expected life of options 6 years 6 years 6 years
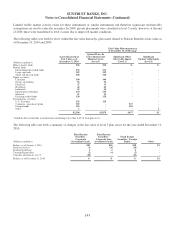
The following table presents a summary of stock option and restricted stock activity:
Stock Options Restricted Stock
Shares
Price
Range
Weighted
Average
Exercise
Price Shares
Deferred
Compensation
Grant Price
Weighted
Average
(Dollars in millions, except per share data)
Balance, January 1, 2008 16,058,146 $17.06 - $85.06 $65.79 2,270,344 $91 $69.63
Granted 1,473,284 29.54 - 64.58 57.43 2,021,564 117 57.90
Exercised/vested (514,149) 18.77 - 65.33 49.16 (213,431) - 55.16
Cancelled/expired/forfeited (1,476,358) 31.80 - 154.61 69.30 (275,065) (18) 64.04
Amortization of restricted stock compensation - - - - (77) -
Acquisition of GB&T 100,949 46.39 - 154.61 76.82 - - -
Balance, December 31, 2008 15,641,872 17.06 - 150.45 65.29 3,803,412 113 64.61
Granted 3,803,796 9.06 9.06 2,565,648 28 10.40
Exercised/vested - - - (1,255,092) - 64.79
Cancelled/expired/forfeited (1,784,452) 9.06 - 149.81 65.39 (343,796) (16) 46.59
Amortization of restricted stock compensation - - - - (66) -
Balance, December 31, 2009 17,661,216 9.06 - 150.45 53.17 4,770,172 59 37.02
Granted 1,192,974 22.69 - 27.79 23.64 1,355,075 33 24.01
Exercised/vested - - - (1,266,267) - 67.27
Cancelled/expired/forfeited (1,711,690) 9.06 - 140.14 52.62 (238,171) (7) 29.22
Amortization of restricted stock compensation - - - - (42) -
Balance, December 31, 2010 17,142,500 $9.06 - $150.45 $51.17 4,620,809 $43 $25.32
Exercisable, December 31, 2010 11,232,650 $66.64
Available for Additional Grant, December 31, 2010 17,912,073
1Includes 3,085,432 million shares available to be issued as restricted stock.
138