SunTrust 2010 Annual Report Download - page 57
Download and view the complete annual report
Please find page 57 of the 2010 SunTrust annual report below. You can navigate through the pages in the report by either clicking on the pages listed below, or by using the keyword search tool below to find specific information within the annual report.-
 1
1 -
2
-
3
-
4
-
5
-
6
-
7
-
8
-
9
-
10
-
11
-
12
-
13
-
14
-
15
-
16
-
17
-
18
-
19
-
20
-
21
-
22
-
23
-
24
-
25
-
26
-
27
-
28
-
29
-
30
-
31
-
32
-
33
-
34
-
35
-
36
-
37
-
38
-
39
-
40
-
41
-
42
-
43
-
44
-
45
-
46
-
 47
47 -
 48
48 -
 49
49 -
 50
50 -
 51
51 -
 52
52 -
 53
53 -
 54
54 -
 55
55 -
 56
56 -
 57
57 -
 58
58 -
 59
59 -
 60
60 -
 61
61 -
 62
62 -
 63
63 -
 64
64 -
 65
65 -
 66
66 -
 67
67 -
68
-
69
-
70
-
71
-
72
-
73
-
74
-
75
-
76
-
77
-
78
-
79
-
80
-
81
-
82
-
83
-
84
-
85
-
86
-
87
-
88
-
89
-
90
-
91
-
92
-
93
-
94
-
95
-
96
-
97
-
98
-
99
-
100
-
101
-
102
-
103
-
104
-
105
-
106
-
107
-
108
-
109
-
110
-
111
-
112
-
113
-
114
-
115
-
116
-
117
-
118
-
119
-
120
-
121
-
122
-
123
-
124
-
125
-
126
-
127
-
128
-
129
-
130
-
131
-
132
-
133
-
134
-
135
-
136
-
137
-
138
-
139
-
140
-
141
-
142
-
143
-
144
-
145
-
146
-
147
-
148
-
149
-
150
-
151
-
152
-
153
-
154
-
155
-
156
-
157
-
158
-
159
-
160
-
161
-
162
-
163
-
164
-
165
-
166
-
167
-
168
-
169
-
170
-
171
-
172
-
173
-
174
-
175
-
176
-
177
-
178
-
179
-
180
-
181
-
182
-
183
-
184
-
185
-
186
-
187
-
188
-
189
-
190
-
191
-
192
-
193
-
194
-
195
-
196
-
197
-
198
-
199
-
200
-
201
-
202
-
203
-
204
-
205
-
206
-
207
-
208
-
209
-
210
-
211
-
212
-
213
-
214
-
215
-
216
-
217
-
218
-
219
-
220
 |
 |

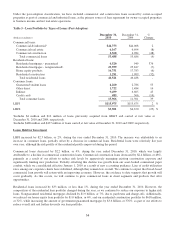
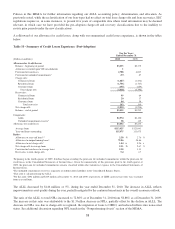
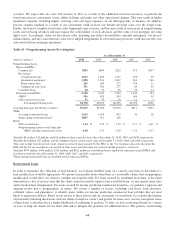
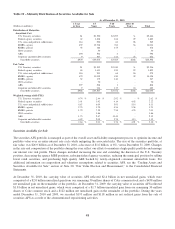
Provision for Credit Losses
The total provision for credit losses includes the provision for loan losses as well as the provision for unfunded
commitments. The provision for loan losses is the result of a detailed analysis performed to estimate an appropriate and
adequate ALLL.
For the year ended December 31, 2010, the provision for loan losses decreased by $1.3 billion, or 32%, to $2.7 billion,
compared to $4.0 billion for the year ended December 31, 2009. The decrease in the provision continued a trend of declining
loan loss provisions over the last year, reflecting an improvement in overall asset quality and a gradually improving
economy.
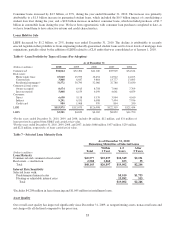
For the year ended December 31, 2010, the provision for unfunded commitments decreased by $144 million to a $57 million
benefit, compared to an $87 million provision for the year ended December 31, 2009. The provision decrease for the year is
primarily attributable to improved credit quality related to certain commercial and large corporate borrowers and secondarily
as a result of a decrease in unfunded commitment exposure.
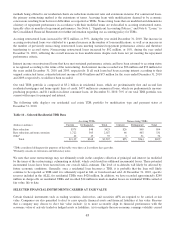
Although net charge-offs and provisions have recently declined, and despite indications of an improving economy, we expect
net charge-offs and the provision for loan losses to remain elevated until we experience a sustained improvement in
economic conditions. We believe the amount of future changes in the ALLL remains highly correlated to unemployment
levels, changes in home prices within our markets, especially Florida, as well as sustained improvement in our portfolio-
specific asset quality indicators. See the “Allowance for Credit Losses,” “Charge-offs,” and “Nonperforming Assets”
sections within this MD&A for additional discussion of our expectations for asset quality.
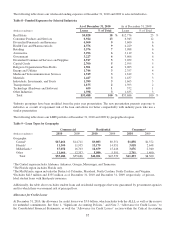
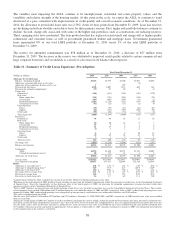
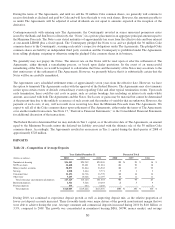
Nonperforming Assets
As previously noted, while the reclassification of our loan types had no effect on total NPLs, SEC regulations require us, in
some instances, to present five years of comparable data where trend information may be deemed relevant, in which case we
have provided the pre-adoption NPL classifications due to the inability to restate prior periods under the new classifications.
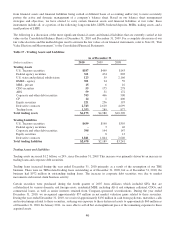
Table 14 - Nonperforming Assets (Post-Adoption)
(Dollars in millions)
December 31,
2010
December 31,
2009
%
Change
Nonaccrual/NPLs:
Commercial loans
Commercial & industrial1$584 $732 (20)
Commercial real estate 342 191 79
Commercial construction 961 1,247 (23)
Total commercial NPLs 1,887 2,170 (13)
Residential loans
Residential mortgages - nonguaranteed21,543 2,283 (32)
Home equity products 355 367 (3)
Residential construction 290 529 (45)
Total residential NPLs 2,188 3,179 (31)
Consumer loans
Other direct 10 825
Indirect 25 45 (44)
Total consumer NPLs 35 53 (34)
Total nonaccrual/NPLs 4,110 5,402 (24)
OREO3596 620 (4)
Other repossessed assets 52 79 (34)
Total nonperforming assets $4,758 $6,101 (22) %
Accruing loans past due 90 days or more4$1,565 $1,500 4 %
TDRs:
Accruing restructured loans 2,613 1,641 59
Nonaccruing restructured loans51,005 913 10
Ratios:
NPLs to total loans 3.54 % 4.75 %
Nonperforming assets to total loans plus
OREO and other repossessed assets 4.08 5.33
1Includes $4 million and $12 million of loans carried at fair value at December 31, 2010 and 2009, respectively.
2Includes $24 million and $34 million of loans carried at fair value at December 31, 2010 and 2009, respectively.
3Does not include foreclosed real estate related to serviced loans insured by the FHA or the VA. Insurance proceeds due from the FHA and
the VA are recorded as a receivable in other assets until the funds are received and the property is conveyed.
4Includes $979 million of consolidated loans eligible for repurchase from Ginnie Mae and classified as held for sale at December 31, 2009.
5Nonaccruing restructured loans are included in total nonaccrual/NPLs.
41