SunTrust 2010 Annual Report Download - page 53
Download and view the complete annual report
Please find page 53 of the 2010 SunTrust annual report below. You can navigate through the pages in the report by either clicking on the pages listed below, or by using the keyword search tool below to find specific information within the annual report.-
 1
1 -
2
-
3
-
4
-
5
-
6
-
7
-
8
-
9
-
10
-
11
-
12
-
13
-
14
-
15
-
16
-
17
-
18
-
19
-
20
-
21
-
22
-
23
-
24
-
25
-
26
-
27
-
28
-
29
-
30
-
31
-
32
-
33
-
34
-
35
-
36
-
37
-
38
-
39
-
40
-
41
-
42
-
 43
43 -
 44
44 -
 45
45 -
 46
46 -
 47
47 -
 48
48 -
 49
49 -
 50
50 -
 51
51 -
 52
52 -
 53
53 -
 54
54 -
 55
55 -
 56
56 -
 57
57 -
 58
58 -
 59
59 -
 60
60 -
 61
61 -
 62
62 -
 63
63 -
64
-
65
-
66
-
67
-
68
-
69
-
70
-
71
-
72
-
73
-
74
-
75
-
76
-
77
-
78
-
79
-
80
-
81
-
82
-
83
-
84
-
85
-
86
-
87
-
88
-
89
-
90
-
91
-
92
-
93
-
94
-
95
-
96
-
97
-
98
-
99
-
100
-
101
-
102
-
103
-
104
-
105
-
106
-
107
-
108
-
109
-
110
-
111
-
112
-
113
-
114
-
115
-
116
-
117
-
118
-
119
-
120
-
121
-
122
-
123
-
124
-
125
-
126
-
127
-
128
-
129
-
130
-
131
-
132
-
133
-
134
-
135
-
136
-
137
-
138
-
139
-
140
-
141
-
142
-
143
-
144
-
145
-
146
-
147
-
148
-
149
-
150
-
151
-
152
-
153
-
154
-
155
-
156
-
157
-
158
-
159
-
160
-
161
-
162
-
163
-
164
-
165
-
166
-
167
-
168
-
169
-
170
-
171
-
172
-
173
-
174
-
175
-
176
-
177
-
178
-
179
-
180
-
181
-
182
-
183
-
184
-
185
-
186
-
187
-
188
-
189
-
190
-
191
-
192
-
193
-
194
-
195
-
196
-
197
-
198
-
199
-
200
-
201
-
202
-
203
-
204
-
205
-
206
-
207
-
208
-
209
-
210
-
211
-
212
-
213
-
214
-
215
-
216
-
217
-
218
-
219
-
220
 |
 |

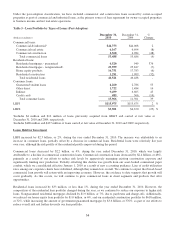
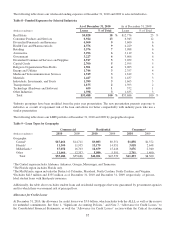
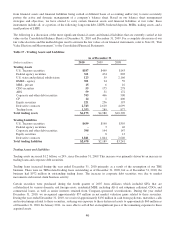
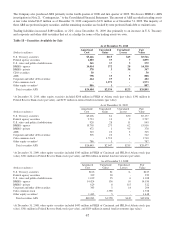
The following table shows our wholesale lending exposure at December 31, 2010 and 2009 to selected industries.
Table 8 - Funded Exposures by Selected Industries
As of December 31, 2010 As of December 31, 20091
(Dollars in millions) Loans % of Total Loans % of Total
Real Estate $9,828 18 % $12,776 23 %
Consumer Products and Services 6,924 13 6,945 12
Diversified Financials and Insurance 4,960 9 3,600 6
Health Care and Pharmaceuticals 4,576 9 4,229 8
Retailing 3,576 7 3,088 6
Automotive 3,296 6 3,119 6
Government 3,227 6 3,606 6
Diversified Commercial Services and Supplies 2,917 5 3,052 5
Capital Goods 2,700 5 2,595 5
Religious Organizations/Non-Profits 1,961 4 2,005 4
Energy and Utilities 1,746 3 2,357 4
Media and Telecommunication Services 1,519 3 1,612 3
Materials 1,447 3 1,437 3
Individuals, Investments, and Trusts 1,399 3 1,665 3
Transportation 1,155 2 1,393 2
Technology (Hardware and Software) 659 1 572 1
Other Industries 1,598 3 1,635 3
Total $53,488 100 % $55,686 100 %
1Industry groupings have been modified from the prior year presentation. The new presentation presents exposure to
industries as a result of repayment risk of the loan and allows for better comparability with industry peers who use a
similar presentation.
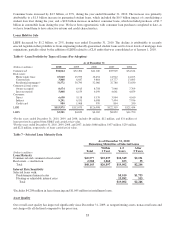
The following table shows our LHFI portfolio at December 31, 2010 and 2009 by geographical region.
Table 9 – Loan Types by Geography
Commercial Residential Consumer4
(Dollars in millions) 2010 2009 2010 2009 2010 2009
Geography:
Central1$15,466 $14,711 $9,083 $9,551 $1,858 $1,372
Florida211,300 11,935 13,179 14,951 3,018 2,648
MidAtlantic315,058 16,703 14,659 15,446 3,676 2,940
Other 11,664 12,337 5,080 5,591 2,741 1,400
Total $53,488 $55,686 $42,001 $45,539 $11,293 $8,360
1The Central region includes Alabama, Arkansas, Georgia, Mississippi, and Tennessee.
2The Florida region includes Florida only.
3The MidAtlantic region includes the District of Columbia, Maryland, North Carolina, South Carolina, and Virginia.
4Excludes $413 million and $355 million as of December 31, 2010 and December 31, 2009, respectively, of private-
label student loans with third-party insurance.
Additionally, the table above excludes student loans and residential mortgages that were guaranteed by government agencies
and for which there was nominal risk of principal loss.
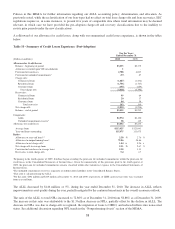
Allowance for Credit Losses
At December 31, 2010, the allowance for credit losses was $3.0 billion, which includes both the ALLL as well as the reserve
for unfunded commitments. See Note 1, “Significant Accounting Policies,” and Note 7, “Allowance for Credit Losses,” to
the Consolidated Financial Statements, as well the “Allowance for Credit Losses” section within the Critical Accounting
37