SunTrust 2010 Annual Report Download - page 132
Download and view the complete annual report
Please find page 132 of the 2010 SunTrust annual report below. You can navigate through the pages in the report by either clicking on the pages listed below, or by using the keyword search tool below to find specific information within the annual report.-
 1
1 -
2
-
3
-
4
-
5
-
6
-
7
-
8
-
9
-
10
-
11
-
12
-
13
-
14
-
15
-
16
-
17
-
18
-
19
-
20
-
21
-
22
-
23
-
24
-
25
-
26
-
27
-
28
-
29
-
30
-
31
-
32
-
33
-
34
-
35
-
36
-
37
-
38
-
39
-
40
-
41
-
42
-
43
-
44
-
45
-
46
-
47
-
48
-
49
-
50
-
51
-
52
-
53
-
54
-
55
-
56
-
57
-
58
-
59
-
60
-
61
-
62
-
63
-
64
-
65
-
66
-
67
-
68
-
69
-
70
-
71
-
72
-
73
-
74
-
75
-
76
-
77
-
78
-
79
-
80
-
81
-
82
-
83
-
84
-
85
-
86
-
87
-
88
-
89
-
90
-
91
-
92
-
93
-
94
-
95
-
96
-
97
-
98
-
99
-
100
-
101
-
102
-
103
-
104
-
105
-
106
-
107
-
108
-
109
-
110
-
111
-
112
-
113
-
114
-
115
-
116
-
117
-
118
-
119
-
120
-
121
-
 122
122 -
 123
123 -
 124
124 -
 125
125 -
 126
126 -
 127
127 -
 128
128 -
 129
129 -
 130
130 -
 131
131 -
 132
132 -
 133
133 -
 134
134 -
 135
135 -
 136
136 -
 137
137 -
 138
138 -
 139
139 -
 140
140 -
 141
141 -
 142
142 -
143
-
144
-
145
-
146
-
147
-
148
-
149
-
150
-
151
-
152
-
153
-
154
-
155
-
156
-
157
-
158
-
159
-
160
-
161
-
162
-
163
-
164
-
165
-
166
-
167
-
168
-
169
-
170
-
171
-
172
-
173
-
174
-
175
-
176
-
177
-
178
-
179
-
180
-
181
-
182
-
183
-
184
-
185
-
186
-
187
-
188
-
189
-
190
-
191
-
192
-
193
-
194
-
195
-
196
-
197
-
198
-
199
-
200
-
201
-
202
-
203
-
204
-
205
-
206
-
207
-
208
-
209
-
210
-
211
-
212
-
213
-
214
-
215
-
216
-
217
-
218
-
219
-
220
 |
 |

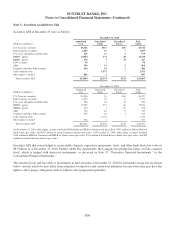
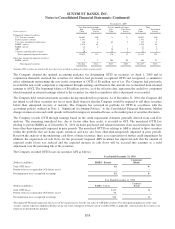
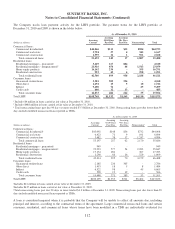
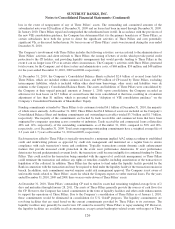
SUNTRUST BANKS, INC.
Notes to Consolidated Financial Statements (Continued)
As of December 31, 2009
Commercial Residential Consumer Total
(Dollars in millions)
Carrying
Value
Associated
ALLL
Carrying
Value
Associated
ALLL
Carrying
Value
Associated
ALLL
Carrying
Value
Associated
ALLL
LHFI individually evaluated for
impairment $1,295 $194 $2,452 $343 $6 $1 $3,753 $538
LHFI collectively evaluated for
impairment 54,379 1,159 43,599 1,249 11,495 174 109,473 2,582
Total LHFI evaluated for
impairment 55,674 1,353 46,051 1,592 11,501 175 113,226 3,120
LHFI at fair value 12 - 437 - - - 449 -
Total LHFI $55,686 $1,353 $46,488 $1,592 $11,501 $175 $113,675 $3,120
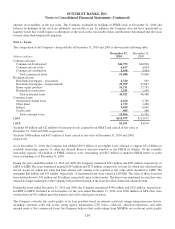
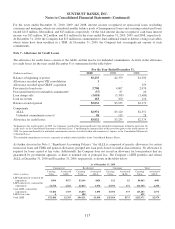
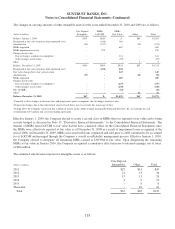
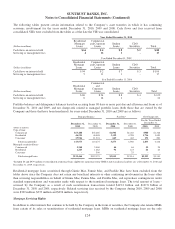
Note 8 - Premises and Equipment
Premises and equipment as of December 31 consisted of the following:
(Dollars in millions) Useful Life 2010 2009
Land Indefinite $353 $341
Buildings and improvements 2 - 40 years 1,008 974
Leasehold improvements 1 - 30 years 577 535
Furniture and equipment 1 - 20 years 1,385 1,312
Construction in progress 168 170
3,491 3,332
Less accumulated depreciation and amortization 1,871 1,780
Total premises and equipment $1,620 $1,552
During 2008, the Company completed sale/leaseback transactions, consisting of 152 branch properties and various individual
office buildings. In total, the Company sold and concurrently leased back $202 million in land and buildings with associated
accumulated depreciation of $110 million. Net proceeds were $289 million, resulting in a gross gain, net of transaction costs,
of $197 million. For the year ended December 31, 2008, the Company recognized $37 million of the gain immediately. The
remaining $160 million in gains were deferred and are being recognized ratably over the expected term of the respective
leases, predominantly 10 years, as an offset to net occupancy expense.
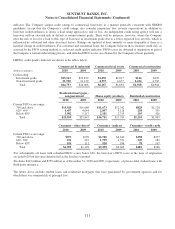
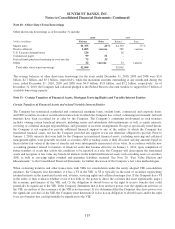
The carrying amounts of premises and equipment subject to mortgage indebtedness (included in long-term debt) were not
significant as of December 31, 2010 and 2009.
Various Company facilities are leased under both capital and noncancelable operating leases with initial remaining terms in
excess of one year. Minimum payments, by year and in aggregate, as of December 31, 2010 were as follows:
(Dollars in millions)
Operating
Leases
Capital
Leases
2011 $209 $2
2012 196 2
2013 183 2
2014 171 2
2015 156 2
Thereafter 561 9
Total minimum lease payments $1,476 $19
Amounts representing interest 5
Present value of net minimum lease payments $14
Net premises and equipment included $7 million and $8 million as of December 31, 2010 and 2009, respectively, related to
capital leases. Aggregate rent expense (principally for offices), including contingent rent expense and sublease income,
totaled $179 million for 2010 and $171 million for both 2009 and 2008. Depreciation/amortization expense for the years
ended December 31, 2010, 2009, and 2008 totaled $177 million, $182 million, and $196 million, respectively.
116