SunTrust 2010 Annual Report Download - page 49
Download and view the complete annual report
Please find page 49 of the 2010 SunTrust annual report below. You can navigate through the pages in the report by either clicking on the pages listed below, or by using the keyword search tool below to find specific information within the annual report.-
 1
1 -
2
-
3
-
4
-
5
-
6
-
7
-
8
-
9
-
10
-
11
-
12
-
13
-
14
-
15
-
16
-
17
-
18
-
19
-
20
-
21
-
22
-
23
-
24
-
25
-
26
-
27
-
28
-
29
-
30
-
31
-
32
-
33
-
34
-
35
-
36
-
37
-
38
-
 39
39 -
 40
40 -
 41
41 -
 42
42 -
 43
43 -
 44
44 -
 45
45 -
 46
46 -
 47
47 -
 48
48 -
 49
49 -
 50
50 -
 51
51 -
 52
52 -
 53
53 -
 54
54 -
 55
55 -
 56
56 -
 57
57 -
 58
58 -
 59
59 -
60
-
61
-
62
-
63
-
64
-
65
-
66
-
67
-
68
-
69
-
70
-
71
-
72
-
73
-
74
-
75
-
76
-
77
-
78
-
79
-
80
-
81
-
82
-
83
-
84
-
85
-
86
-
87
-
88
-
89
-
90
-
91
-
92
-
93
-
94
-
95
-
96
-
97
-
98
-
99
-
100
-
101
-
102
-
103
-
104
-
105
-
106
-
107
-
108
-
109
-
110
-
111
-
112
-
113
-
114
-
115
-
116
-
117
-
118
-
119
-
120
-
121
-
122
-
123
-
124
-
125
-
126
-
127
-
128
-
129
-
130
-
131
-
132
-
133
-
134
-
135
-
136
-
137
-
138
-
139
-
140
-
141
-
142
-
143
-
144
-
145
-
146
-
147
-
148
-
149
-
150
-
151
-
152
-
153
-
154
-
155
-
156
-
157
-
158
-
159
-
160
-
161
-
162
-
163
-
164
-
165
-
166
-
167
-
168
-
169
-
170
-
171
-
172
-
173
-
174
-
175
-
176
-
177
-
178
-
179
-
180
-
181
-
182
-
183
-
184
-
185
-
186
-
187
-
188
-
189
-
190
-
191
-
192
-
193
-
194
-
195
-
196
-
197
-
198
-
199
-
200
-
201
-
202
-
203
-
204
-
205
-
206
-
207
-
208
-
209
-
210
-
211
-
212
-
213
-
214
-
215
-
216
-
217
-
218
-
219
-
220
 |
 |
proposal, the calculation will be based on net assets, not on deposits, which will raise our assessment base beginning in the
second quarter of 2011; however, we expect that over time, the higher assessment base will be mitigated as improving
operating trends, such as asset quality and earnings, favorably impact future premium calculations. While all of this may lead
to some volatility in our quarterly expense, we do not expect a significant increase in our 2011 expense base.
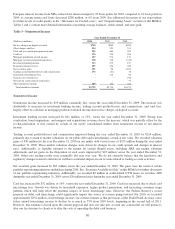
Personnel expense increased by $21 million, or 1%, versus the year ended December 31, 2009. The increase was attributable
to higher salaries, incentive compensation, and contract labor expenses, offset by a reduction in pension and other
postretirement benefit expenses as a result of improved performance in the underlying plan assets in 2010. Full-time
equivalent employees increased by 1,055 compared to December 31, 2009, with the majority of the increase resulting from
hiring within our technology, mortgage, retail branches, and client support areas. These increases are a direct result of our
commitment to investing in our business. Higher incentive compensation expense resulted from the strong revenue
performance of certain business lines during 2010.
Outside processing and software costs increased by $59 million, or 10%, versus the year ended December 31, 2009, related
to increased transaction volumes along with client acquisition and risk management technology investments made to enhance
the client experience.
Marketing and customer development costs increased by $25 million, or 16%, versus the year ended December 31, 2009. The
increase was attributable to higher promotional and advertising spending and more broadly as a result of investments made
during the year to aid in the overall growth of our business.
Consulting and legal expenses increased by $27 million, or 47%, versus the year ended December 31, 2009. The increase
was attributable to increases in litigation fees and expenses, coupled with an increase in consulting activities.
Net losses on debt extinguishment increased by $31 million versus the year ended December 31, 2009. Net losses on debt
extinguishment in the current year were primarily due to early termination fees on the extinguishments of $1.7 billion in
FHLB borrowings, in addition to the fees paid to repurchase $750 million of our debt in a tender offer during the third
quarter. Net losses in the prior year primarily resulted from early termination fees for FHLB advances repaid during the year,
net of gains on extinguishment of other long-term debt.
Provision for Income Taxes
The provision for income taxes includes both federal and state income taxes. In 2010, the provision for income taxes was a
benefit of $185 million, compared to a benefit of $898 million in 2009. The 2010 effective tax rate was primarily driven by
net favorable permanent tax items such as tax exempt interest income and tax credits significantly exceeding the positive
pre-tax earnings. The 2009 effective tax rate was primarily attributable to the pre-tax loss and further increased by net
favorable permanent tax items such as tax-exempt interest income, federal tax credits and the release of UTBs related to the
completion of audit examinations by several taxing authorities; it was, however, reduced by a non-tax deductible goodwill
impairment. For additional information on the reconciliation of the effective tax rate, refer to Note 15, “Income Taxes,” to
the Consolidated Financial Statements.
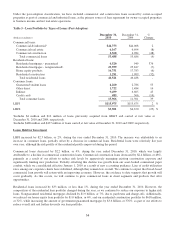
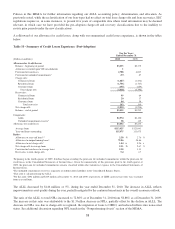
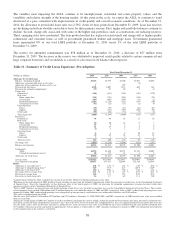
Loans
As discussed in Note 1, “Significant Accounting Policies,” to the Consolidated Financial Statements, we recently adopted
new accounting guidance that requires additional disclosures about the credit quality of our loan portfolios and the credit
reserves held against them. These new disclosures are intended to 1) describe the nature of credit risk inherent in our loan
portfolio, 2) determine how we analyze and assess that risk in arriving at an adequate and appropriate ALLL, and 3) explain
the changes in the ALLL and reasons for those changes. Additionally, the new disclosures are required to be made on a
disaggregated basis by loan portfolio segment and/or by type of loan. A portfolio segment is defined as the level at which we
develop and document our method for determining our ALLL. Loan types are further categories of our portfolio segments. In
conjunction with adopting the new accounting guidance, we have adjusted prior year loan classifications to align with the
current year loan classifications. While the reclassification had no effect on the carrying value of our LHFI or LHFS, SEC
regulations require us, in some instances, to present five years of comparable data where trend information may be deemed
relevant, in which case we have provided the pre-adoption loan classifications due to the inability to restate all prior periods
under the new loan classifications.
33