SunTrust 2010 Annual Report Download - page 91
Download and view the complete annual report
Please find page 91 of the 2010 SunTrust annual report below. You can navigate through the pages in the report by either clicking on the pages listed below, or by using the keyword search tool below to find specific information within the annual report.-
 1
1 -
2
-
3
-
4
-
5
-
6
-
7
-
8
-
9
-
10
-
11
-
12
-
13
-
14
-
15
-
16
-
17
-
18
-
19
-
20
-
21
-
22
-
23
-
24
-
25
-
26
-
27
-
28
-
29
-
30
-
31
-
32
-
33
-
34
-
35
-
36
-
37
-
38
-
39
-
40
-
41
-
42
-
43
-
44
-
45
-
46
-
47
-
48
-
49
-
50
-
51
-
52
-
53
-
54
-
55
-
56
-
57
-
58
-
59
-
60
-
61
-
62
-
63
-
64
-
65
-
66
-
67
-
68
-
69
-
70
-
71
-
72
-
73
-
74
-
75
-
76
-
77
-
78
-
79
-
80
-
 81
81 -
 82
82 -
 83
83 -
 84
84 -
 85
85 -
 86
86 -
 87
87 -
 88
88 -
 89
89 -
 90
90 -
 91
91 -
 92
92 -
 93
93 -
 94
94 -
 95
95 -
 96
96 -
 97
97 -
 98
98 -
 99
99 -
 100
100 -
 101
101 -
102
-
103
-
104
-
105
-
106
-
107
-
108
-
109
-
110
-
111
-
112
-
113
-
114
-
115
-
116
-
117
-
118
-
119
-
120
-
121
-
122
-
123
-
124
-
125
-
126
-
127
-
128
-
129
-
130
-
131
-
132
-
133
-
134
-
135
-
136
-
137
-
138
-
139
-
140
-
141
-
142
-
143
-
144
-
145
-
146
-
147
-
148
-
149
-
150
-
151
-
152
-
153
-
154
-
155
-
156
-
157
-
158
-
159
-
160
-
161
-
162
-
163
-
164
-
165
-
166
-
167
-
168
-
169
-
170
-
171
-
172
-
173
-
174
-
175
-
176
-
177
-
178
-
179
-
180
-
181
-
182
-
183
-
184
-
185
-
186
-
187
-
188
-
189
-
190
-
191
-
192
-
193
-
194
-
195
-
196
-
197
-
198
-
199
-
200
-
201
-
202
-
203
-
204
-
205
-
206
-
207
-
208
-
209
-
210
-
211
-
212
-
213
-
214
-
215
-
216
-
217
-
218
-
219
-
220
 |
 |

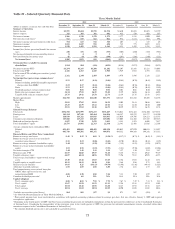
Table 29 – Selected Quarterly Financial Data
Three Months Ended
(Dollars in millions, except per share and other data)
2010 2009
December 31 September 30 June 30 March 31 December 31 September 30 June 30 March 31
Summary of Operations
Interest income $1,595 $1,604 $1,570 $1,574 $1,630 $1,658 $1,693 $1,729
Interest expense 329 366 392 402 453 520 603 667
Net interest income 1,266 1,238 1,178 1,172 1,177 1,138 1,090 1,062
Provision for credit losses4512 615 662 862 974 1,134 962 994
Net interest income after provision for credit losses 754 623 516 310 203 4 128 68
Noninterest income11,032 1,047 952 698 742 775 1,072 1,121
Noninterest expense 1,548 1,499 1,503 1,361 1,453 1,429 1,528 2,152
Income/(loss) before provision/(benefit) for income
taxes 238 171 (35) (353) (508) (650) (328) (963)
Net income attributable to noncontrolling interest 84323343
Provision/(benefit) for income taxes 45 14 (50) (194) (263) (336) (149) (151)
Net income/(loss) $185 $153 $12 ($161) ($248) ($317) ($183) ($815)
Net income/(loss) available to common
shareholders $114 $84 ($56) ($229) ($316) ($377) ($164) ($875)
Net interest income-FTE2$1,294 $1,266 $1,208 $1,202 $1,207 $1,168 $1,121 $1,093
Total revenue-FTE22,326 2,313 2,160 1,900 1,949 1,943 2,193 2,214
Total revenue-FTE excluding net securities (gains)/
losses, net22,262 2,244 2,103 1,899 1,876 1,896 2,218 2,211
Net income/(loss) per average common share:3
Diluted 0.23 0.17 (0.11) (0.46) (0.64) (0.76) (0.41) (2.49)
Diluted excluding goodwill/intangible impairment
charges other than MSRs20.23 0.17 (0.11) (0.46) (0.64) (0.76) (0.41) (0.46)
Basic 0.23 0.17 (0.11) (0.46) (0.64) (0.76) (0.41) (2.49)
Dividends paid per average common share 0.01 0.01 0.01 0.01 0.01 0.01 0.10 0.10
Book value per common share 36.34 37.01 36.19 35.40 35.29 36.06 36.16 46.03
Tangible book value per common share223.76 24.42 23.58 22.76 22.59 23.35 23.41 28.15
Market capitalization $14,768 $12,914 $11,648 $13,391 $10,128 $11,256 $8,205 $4,188
Market Price:
High 29.82 27.05 31.92 28.39 24.09 24.43 20.86 30.18
Low 23.25 21.79 23.12 20.16 18.45 14.50 10.50 6.00
Close 29.51 25.83 23.30 26.79 20.29 22.55 16.45 11.74
Selected Average Balances
Total assets $174,768 $171,999 $171,273 $171,429 $174,041 $172,463 $176,480 $178,871
Earning assets 149,114 147,249 145,464 146,896 146,587 149,579 153,177 154,390
Loans 114,930 113,322 113,016 114,435 115,036 119,796 124,123 125,333
Consumer and commercial deposits 119,688 117,233 116,460 115,084 117,008 114,486 113,528 107,515
Brokered and foreign deposits 2,827 2,740 2,670 3,433 5,145 5,193 6,608 7,417
Total shareholders’ equity 23,576 23,091 22,313 22,338 22,381 22,468 21,926 22,368
Average common shares outstanding (000s)
Diluted 499,423 498,802 498,499 498,238 498,082 497,070 400,633 351,897
Basic 495,710 495,501 495,351 494,871 494,332 494,169 399,242 351,352
Financial Ratios and Other Data (Annualized)
Return on average total assets 0.42 % 0.35 % 0.03 % (0.38) % (0.57) % (0.73) % (0.42) % (1.85) %
Return on average assets less net unrealized
securities (gains)/losses20.31 0.23 (0.08) (0.42) (0.70) (0.83) (0.41) (1.89)
Return on average common shareholders equity 2.44 1.83 (1.29) (5.34) (7.19) (8.52) (3.95) (20.71)
Return on average realized common shareholders’
equity21.53 0.70 (2.53) (5.93) (8.81) (9.70) (4.02) (22.08)
Net interest margin- FTE 3.44 3.41 3.33 3.32 3.27 3.10 2.94 2.87
Efficiency ratio- FTE 66.57 64.80 69.57 71.60 74.58 73.53 69.68 97.19
Tangible efficiency ratio266.07 64.24 68.96 70.91 73.96 72.82 69.05 62.55
Total average shareholders’ equity to total average
assets 13.49 13.42 13.03 13.03 12.86 13.03 12.42 12.51
Tangible equity to tangible assets210.12 10.19 10.18 9.86 9.66 9.96 9.75 8.85
Effective tax rate (benefit) 19.66 8.25 (133.13) (54.70) (51.46) (51.46) (44.81) (15.61)
Allowance to period-end loans 2.58 2.69 2.81 2.80 2.76 2.61 2.37 2.21
Total nonperforming assets to total loans plus
OREO, other repossessed assets, and
nonperforming LHFS 4.08 4.38 4.81 5.26 5.33 5.20 4.99 4.21
Common dividend payout ratio54.4 6.0 N/A N/A N/A N/A N/A N/A
Capital Adequacy
Tier 1 common equity 8.08 % 8.02 % 7.92 % 7.70 % 7.67 % 7.49 % 7.34 % 5.83 %
Tier 1 capital 13.67 13.58 13.51 13.13 12.96 12.58 12.23 11.02
Total capital 16.54 16.42 16.96 16.68 16.43 15.92 15.31 14.15
Tier 1 leverage 10.94 11.03 10.94 10.95 10.90 11.08 11.02 10.14
1Includes net securities gains/(losses) $64 $69 $57 $1 $73 $47 ($25) $3
2See Non-GAAP reconcilements in Table 30 of the MD&A.
3Prior period amounts have been recalculated in accordance with updated accounting guidance related to earnings per share, that was effective January 1, 2009 and required
retrospective application .
4Beginning in the fourth quarter of 2009, SunTrust began recording the provision for unfunded commitments within the provision for credit losses in the Consolidated Statements
of Income/(Loss). Considering the immateriality of this provision, prior to the fourth quarter of 2009, the provision for unfunded commitments remains classified within other
noninterest expense in the Consolidated Statements of Income/(Loss).
5The common dividend payout ratio is not calculable in a period of net loss.
75