SunTrust 2010 Annual Report Download - page 134
Download and view the complete annual report
Please find page 134 of the 2010 SunTrust annual report below. You can navigate through the pages in the report by either clicking on the pages listed below, or by using the keyword search tool below to find specific information within the annual report.-
 1
1 -
2
-
3
-
4
-
5
-
6
-
7
-
8
-
9
-
10
-
11
-
12
-
13
-
14
-
15
-
16
-
17
-
18
-
19
-
20
-
21
-
22
-
23
-
24
-
25
-
26
-
27
-
28
-
29
-
30
-
31
-
32
-
33
-
34
-
35
-
36
-
37
-
38
-
39
-
40
-
41
-
42
-
43
-
44
-
45
-
46
-
47
-
48
-
49
-
50
-
51
-
52
-
53
-
54
-
55
-
56
-
57
-
58
-
59
-
60
-
61
-
62
-
63
-
64
-
65
-
66
-
67
-
68
-
69
-
70
-
71
-
72
-
73
-
74
-
75
-
76
-
77
-
78
-
79
-
80
-
81
-
82
-
83
-
84
-
85
-
86
-
87
-
88
-
89
-
90
-
91
-
92
-
93
-
94
-
95
-
96
-
97
-
98
-
99
-
100
-
101
-
102
-
103
-
104
-
105
-
106
-
107
-
108
-
109
-
110
-
111
-
112
-
113
-
114
-
115
-
116
-
117
-
118
-
119
-
120
-
121
-
122
-
123
-
 124
124 -
 125
125 -
 126
126 -
 127
127 -
 128
128 -
 129
129 -
 130
130 -
 131
131 -
 132
132 -
 133
133 -
 134
134 -
 135
135 -
 136
136 -
 137
137 -
 138
138 -
 139
139 -
 140
140 -
 141
141 -
 142
142 -
 143
143 -
 144
144 -
145
-
146
-
147
-
148
-
149
-
150
-
151
-
152
-
153
-
154
-
155
-
156
-
157
-
158
-
159
-
160
-
161
-
162
-
163
-
164
-
165
-
166
-
167
-
168
-
169
-
170
-
171
-
172
-
173
-
174
-
175
-
176
-
177
-
178
-
179
-
180
-
181
-
182
-
183
-
184
-
185
-
186
-
187
-
188
-
189
-
190
-
191
-
192
-
193
-
194
-
195
-
196
-
197
-
198
-
199
-
200
-
201
-
202
-
203
-
204
-
205
-
206
-
207
-
208
-
209
-
210
-
211
-
212
-
213
-
214
-
215
-
216
-
217
-
218
-
219
-
220
 |
 |

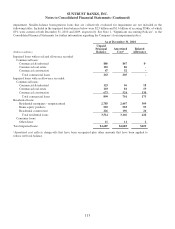
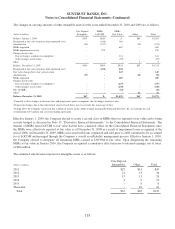
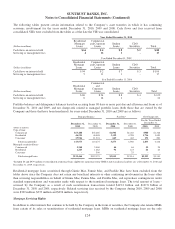
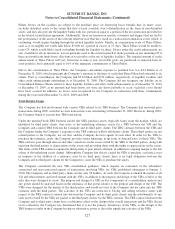
SUNTRUST BANKS, INC.
Notes to Consolidated Financial Statements (Continued)
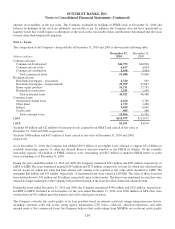
The changes in carrying amounts of other intangible assets for the years ended December 31, 2010 and 2009 are as follows:
(Dollars in millions)
Core Deposit
Intangibles
MSRs
LOCOM
MSRs
Fair Value Other Total
Balance, January 1, 2009 $145 $810 $- $80 $1,035
Designated at fair value (transfers from amortized cost) - (188) 188 - -
Amortization (41) (217) - (15) (273)
MSRs originated - - 682 - 682
MSRs impairment recovery - 199 - - 199
Changes in fair value
Due to changes in inputs or assumptions 1- - 161 - 161
Other changes in fair value 2- - (95) - (95)
Other - - - 2 2
Balance, December 31, 2009 $104 $604 $936 $67 $1,711
Designated at fair value (transfers from amortized cost) - (604) 604 - -
Fair value change due to fair value election - - 145 - 145
Amortization (37) - - (13) (50)
MSRs originated - - 289 - 289
Changes in fair value
Due to changes in inputs or assumptions 1- - (275) - (275)
Other changes in fair value 2- - (238) - (238)
Sale of MSRs - - (22) - (22)
Other 3- - - 11 11
Balance, December 31, 2010 $67 $- $1,439 $65 $1,571
1Primarily reflects changes in discount rates and prepayment speed assumptions, due to changes in interest rates.
2Represents changes due to the collection of expected cash flows, net of accretion, due to passage of time.
3During 2010, the Company transferred $14.1 billion in money market funds to funds managed by Federated Investors, Inc. in exchange for cash
consideration of $7 million and a revenue-sharing agreement.
Effective January 1, 2009, the Company elected to create a second class of MSRs that was reported at fair value and is being
actively hedged as discussed in Note 17, “Derivative Financial Instruments,” to the Consolidated Financial Statements. The
transfer of MSRs from LOCOM to fair value did not have a material effect on the Consolidated Financial Statements since
the MSRs were effectively reported at fair value as of December 31, 2008 as a result of impairment losses recognized at the
end of 2008. At December 31, 2009, MSRs associated with loans originated and sold prior to 2008 continued to be accounted
for at LOCOM and managed through the Company’s overall asset/liability management process. Effective January 1, 2010,
the Company elected to designate all remaining MSRs carried at LOCOM at fair value. Upon designating the remaining
MSRs at fair value in January 2010, the Company recognized a cumulative effect increase to retained earnings, net of taxes,
of $89 million.
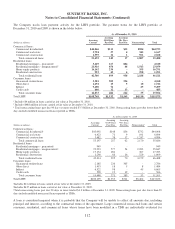
The estimated amortization expense for intangible assets is as follows:
(Dollars in millions)
Core Deposit
Intangibles Other Total
2011 $29 $14 $43
2012 21 13 34
2013 13 11 24
2014 4913
2015 -88
Thereafter -1010
Total $67 $65 $132
118