SunTrust 2010 Annual Report Download - page 58
Download and view the complete annual report
Please find page 58 of the 2010 SunTrust annual report below. You can navigate through the pages in the report by either clicking on the pages listed below, or by using the keyword search tool below to find specific information within the annual report.-
 1
1 -
2
-
3
-
4
-
5
-
6
-
7
-
8
-
9
-
10
-
11
-
12
-
13
-
14
-
15
-
16
-
17
-
18
-
19
-
20
-
21
-
22
-
23
-
24
-
25
-
26
-
27
-
28
-
29
-
30
-
31
-
32
-
33
-
34
-
35
-
36
-
37
-
38
-
39
-
40
-
41
-
42
-
43
-
44
-
45
-
46
-
47
-
 48
48 -
 49
49 -
 50
50 -
 51
51 -
 52
52 -
 53
53 -
 54
54 -
 55
55 -
 56
56 -
 57
57 -
 58
58 -
 59
59 -
 60
60 -
 61
61 -
 62
62 -
 63
63 -
 64
64 -
 65
65 -
 66
66 -
 67
67 -
 68
68 -
69
-
70
-
71
-
72
-
73
-
74
-
75
-
76
-
77
-
78
-
79
-
80
-
81
-
82
-
83
-
84
-
85
-
86
-
87
-
88
-
89
-
90
-
91
-
92
-
93
-
94
-
95
-
96
-
97
-
98
-
99
-
100
-
101
-
102
-
103
-
104
-
105
-
106
-
107
-
108
-
109
-
110
-
111
-
112
-
113
-
114
-
115
-
116
-
117
-
118
-
119
-
120
-
121
-
122
-
123
-
124
-
125
-
126
-
127
-
128
-
129
-
130
-
131
-
132
-
133
-
134
-
135
-
136
-
137
-
138
-
139
-
140
-
141
-
142
-
143
-
144
-
145
-
146
-
147
-
148
-
149
-
150
-
151
-
152
-
153
-
154
-
155
-
156
-
157
-
158
-
159
-
160
-
161
-
162
-
163
-
164
-
165
-
166
-
167
-
168
-
169
-
170
-
171
-
172
-
173
-
174
-
175
-
176
-
177
-
178
-
179
-
180
-
181
-
182
-
183
-
184
-
185
-
186
-
187
-
188
-
189
-
190
-
191
-
192
-
193
-
194
-
195
-
196
-
197
-
198
-
199
-
200
-
201
-
202
-
203
-
204
-
205
-
206
-
207
-
208
-
209
-
210
-
211
-
212
-
213
-
214
-
215
-
216
-
217
-
218
-
219
-
220
 |
 |

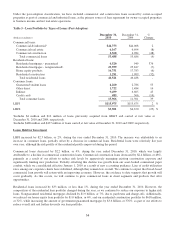
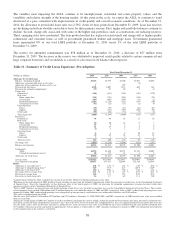
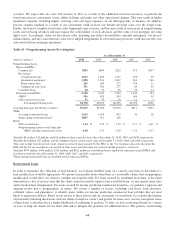
Nonperforming assets decreased by $1.3 billion, or 22%, during the year ended December 31, 2010. The decrease was
attributable to a $1.3 billion reduction in NPLs as a result of our problem resolution efforts and the continued trend of lower
NPL inflows.
Nonperforming commercial loans decreased by $283 million, or 13%, during the year ended December 31, 2010, primarily
as a result of a $286 million decrease in commercial construction NPLs and a $148 million decrease in commercial and
industrial NPLs, partially offset by a $151 million increase in commercial real estate NPLs. The overall decrease was driven
primarily by net charge-offs of existing nonperforming commercial loans, partially offset by the migration of delinquent
commercial loans to nonaccrual status. We believe that the increase in commercial real estate NPLs is related to a
continuation of the current commercial real estate correction, and we expect some variability in the performance as this cycle
plays out.
Nonperforming residential loans decreased by $991 million, or 31%, during the year ended December 31, 2010, primarily as
a result of a $740 million decrease in nonguaranteed residential mortgage NPLs. The decrease was attributable to lower
inflows of NPLs, net charge-offs, and the sale of certain residential NPLs in the second quarter of 2010.
Nonperforming consumer loans decreased by $18 million, or 34%, during the year ended December 31, 2010, primarily as a
result of a $20 million decrease in indirect consumer NPLs. The decrease was driven by net charge-offs of existing
nonperforming consumer loans during the year, partially offset by the migration of delinquent consumer loans to nonaccrual
status.
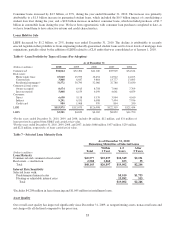
OREO decreased by $24 million, or 4%, during the year ended December 31, 2010. The decline consisted of a $7 million
decrease in residential construction related properties and a decrease in commercial properties of $20 million, partially offset
by a $3 million increase in residential homes. During the years ended December 31, 2010 and 2009, sales of OREO resulted
in proceeds of $769 million and $544 million, respectively, and net losses on sales of $55 million and net gains on sales of
$26 million, respectively, excluding changes in the valuation reserve attributable to lots and land for which current property-
specific values were not available prior to sale. Sales of OREO and the related gains or losses are highly dependent on our
disposition strategy and buyer opportunities. See Note 20, “Fair Value Election and Measurement,” to the Consolidated
Financial Statements for more information. Gains and losses on sale of OREO are recorded in other real estate expense in the
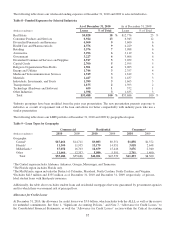
Consolidated Statements of Income/(Loss). Geographically, most of our OREO properties are located in Georgia, Florida,
and North Carolina. Residential properties and land comprised 52% and 36%, respectively, of OREO; the remainder is
related to commercial and other properties. Upon foreclosure, these properties were re-evaluated and, if necessary, written
down to their then-current estimated value, less costs to sell. Further declines in home prices could result in additional losses
on these properties. We are actively managing and disposing of these foreclosed assets to minimize future losses.
Other repossessed assets decreased by $27 million, or 34%, during the year ended December 31, 2010. The decrease is
largely attributable to impairment charges and sales of repossessed assets during the year, partially offset by additional
repossessions during the year.
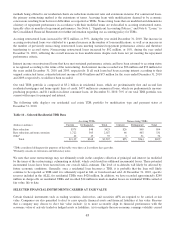
Accruing loans past due ninety days or more increased by $65 million, or 4%, during the year ended December 31, 2010.
Included in the accruing loan population were $884 million and $979 million of residential mortgages at December 31, 2010
and 2009, respectively, which were fully insured by the FHA or the VA. Also included in the population of accruing loans
past due ninety days or more were $596 million and $365 million of federally guaranteed student loans at December 31, 2010
and 2009, respectively.
Interest income on nonaccrual loans, if recognized, is recorded using the cash basis method of accounting. Such interest
income recorded was $39 million and $36 million for the years ended December 31, 2010 and 2009, respectively. If all such
loans had been accruing interest according to their original contractual terms, estimated interest income of $340 million and
$354 million for the years ended December 31, 2010 and 2009, respectively, would have been recorded.
Review of Foreclosure Practices
We have observed an increase in the amount of time it takes us to foreclose upon residential real estate collateral in certain
states, primarily Florida, which we believe is attributable to delays in the foreclosure process.
We recently conducted an assessment of our foreclosure process in all states. Our review indicated approximately 4,000 files,
or less than 15% of active foreclosure proceedings, contained documents with technical issues in the foreclosure complaint
42