SunTrust 2010 Annual Report Download - page 181
Download and view the complete annual report
Please find page 181 of the 2010 SunTrust annual report below. You can navigate through the pages in the report by either clicking on the pages listed below, or by using the keyword search tool below to find specific information within the annual report.-
 1
1 -
2
-
3
-
4
-
5
-
6
-
7
-
8
-
9
-
10
-
11
-
12
-
13
-
14
-
15
-
16
-
17
-
18
-
19
-
20
-
21
-
22
-
23
-
24
-
25
-
26
-
27
-
28
-
29
-
30
-
31
-
32
-
33
-
34
-
35
-
36
-
37
-
38
-
39
-
40
-
41
-
42
-
43
-
44
-
45
-
46
-
47
-
48
-
49
-
50
-
51
-
52
-
53
-
54
-
55
-
56
-
57
-
58
-
59
-
60
-
61
-
62
-
63
-
64
-
65
-
66
-
67
-
68
-
69
-
70
-
71
-
72
-
73
-
74
-
75
-
76
-
77
-
78
-
79
-
80
-
81
-
82
-
83
-
84
-
85
-
86
-
87
-
88
-
89
-
90
-
91
-
92
-
93
-
94
-
95
-
96
-
97
-
98
-
99
-
100
-
101
-
102
-
103
-
104
-
105
-
106
-
107
-
108
-
109
-
110
-
111
-
112
-
113
-
114
-
115
-
116
-
117
-
118
-
119
-
120
-
121
-
122
-
123
-
124
-
125
-
126
-
127
-
128
-
129
-
130
-
131
-
132
-
133
-
134
-
135
-
136
-
137
-
138
-
139
-
140
-
141
-
142
-
143
-
144
-
145
-
146
-
147
-
148
-
149
-
150
-
151
-
152
-
153
-
154
-
155
-
156
-
157
-
158
-
159
-
160
-
161
-
162
-
163
-
164
-
165
-
166
-
167
-
168
-
169
-
170
-
 171
171 -
 172
172 -
 173
173 -
 174
174 -
 175
175 -
 176
176 -
 177
177 -
 178
178 -
 179
179 -
 180
180 -
 181
181 -
 182
182 -
 183
183 -
 184
184 -
 185
185 -
 186
186 -
 187
187 -
 188
188 -
 189
189 -
 190
190 -
 191
191 -
192
-
193
-
194
-
195
-
196
-
197
-
198
-
199
-
200
-
201
-
202
-
203
-
204
-
205
-
206
-
207
-
208
-
209
-
210
-
211
-
212
-
213
-
214
-
215
-
216
-
217
-
218
-
219
-
220
 |
 |

SUNTRUST BANKS, INC.
Notes to Consolidated Financial Statements (Continued)
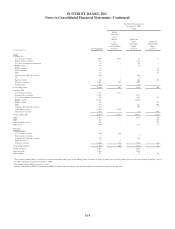
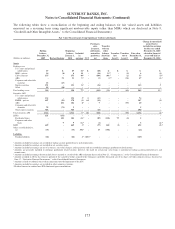
The following tables present the difference between the aggregate fair value and the aggregate unpaid principal balance of
trading assets, LHFI, LHFS, brokered deposits, and long-term debt instruments for which the FVO has been elected. For
LHFI and LHFS for which the FVO has been elected, the tables also include the difference between aggregate fair value and
the aggregate unpaid principal balance of loans that are 90 days or more past due, as well as loans in nonaccrual status.
(Dollars in millions)
Aggregate
Fair Value
December 31, 2010
Aggregate
Unpaid Principal
Balance under FVO
December 31, 2010
Fair Value
Over/(Under)
Unpaid Principal
Trading assets $1,353 $1,320 $33
LHFI 462 517 (55)
Past due loans of 90 days or more 2 4 (2)
Nonaccrual loans 28 54 (26)
LHFS 3,160 3,155 5
Past due loans of 90 days or more 22 -
Nonaccrual loans 6 25 (19)
Brokered deposits 1,213 1,188 25
Long-term debt 2,837 2,753 84
(Dollars in millions)
Aggregate
Fair Value
December 31, 2009
Aggregate
Unpaid Principal
Balance under FVO
December 31, 2009
Fair Value
Over/(Under)
Unpaid Principal
Trading assets $289 $262 $27
LHFI 398 454 (56)
Past due loans of 90 days or more 5 8 (3)
Nonaccrual loans 46 83 (37)
LHFS 2,889 2,875 14
Past due loans of 90 days or more 3 5 (2)
Nonaccrual loans 31 52 (21)
Brokered deposits 1,261 1,320 (59)
Long-term debt 3,586 3,613 (27)
The following tables present the change in fair value during the years ended December 31, 2010 and 2009 of financial
instruments for which the FVO has been elected.
Fair Value Gain/(Loss) for the Year Ended
December 31, 2010, for Items Measured at Fair Value Pursuant
to Election of the FVO
(Dollars in millions)
Trading Account
Profits/(Losses)
and
Commissions
Mortgage
Production
Related Income 2
Mortgage
Servicing
Related Income
Total Changes in
Fair Values
Included in
Current Period
Earnings1
Assets
Trading assets ($3) $- $- ($3)
LHFS 26 568 - 594
LHFI -7 -7
MSRs - 15 (513) (498)
Liabilities
Brokered deposits (62) - - (62)
Long-term debt (168) - - (168)
1Changes in fair value for the year ended December 31, 2010, exclude accrued interest for the periods then ended. Interest income or interest
expense on trading assets, LHFI, LHFS, brokered deposits and long-term debt that have been elected to be carried at fair value are recorded in
interest income or interest expense in the Consolidated Statements of Income/(Loss) based on their contractual coupons. Certain trading assets do
not have a contractually stated coupon and, for these securities, the Company records interest income based on the effective yield calculated upon
acquisition of the securities.
2For the year ended December 31, 2010, income related to LHFS includes $274 million related to MSRs recognized upon the sale of loans reported
at fair value. For the year ended December 31, 2010, income related to MSRs includes $15 million of MSRs recognized upon the sale of loans
reported at LOCOM. These MSRs are included in the table since the Company elected to report MSRs recognized in 2009 using the fair value
method. Previously, MSRs were reported under the amortized cost method.
165