SunTrust 2010 Annual Report Download - page 52
Download and view the complete annual report
Please find page 52 of the 2010 SunTrust annual report below. You can navigate through the pages in the report by either clicking on the pages listed below, or by using the keyword search tool below to find specific information within the annual report.-
 1
1 -
2
-
3
-
4
-
5
-
6
-
7
-
8
-
9
-
10
-
11
-
12
-
13
-
14
-
15
-
16
-
17
-
18
-
19
-
20
-
21
-
22
-
23
-
24
-
25
-
26
-
27
-
28
-
29
-
30
-
31
-
32
-
33
-
34
-
35
-
36
-
37
-
38
-
39
-
40
-
41
-
 42
42 -
 43
43 -
 44
44 -
 45
45 -
 46
46 -
 47
47 -
 48
48 -
 49
49 -
 50
50 -
 51
51 -
 52
52 -
 53
53 -
 54
54 -
 55
55 -
 56
56 -
 57
57 -
 58
58 -
 59
59 -
 60
60 -
 61
61 -
 62
62 -
63
-
64
-
65
-
66
-
67
-
68
-
69
-
70
-
71
-
72
-
73
-
74
-
75
-
76
-
77
-
78
-
79
-
80
-
81
-
82
-
83
-
84
-
85
-
86
-
87
-
88
-
89
-
90
-
91
-
92
-
93
-
94
-
95
-
96
-
97
-
98
-
99
-
100
-
101
-
102
-
103
-
104
-
105
-
106
-
107
-
108
-
109
-
110
-
111
-
112
-
113
-
114
-
115
-
116
-
117
-
118
-
119
-
120
-
121
-
122
-
123
-
124
-
125
-
126
-
127
-
128
-
129
-
130
-
131
-
132
-
133
-
134
-
135
-
136
-
137
-
138
-
139
-
140
-
141
-
142
-
143
-
144
-
145
-
146
-
147
-
148
-
149
-
150
-
151
-
152
-
153
-
154
-
155
-
156
-
157
-
158
-
159
-
160
-
161
-
162
-
163
-
164
-
165
-
166
-
167
-
168
-
169
-
170
-
171
-
172
-
173
-
174
-
175
-
176
-
177
-
178
-
179
-
180
-
181
-
182
-
183
-
184
-
185
-
186
-
187
-
188
-
189
-
190
-
191
-
192
-
193
-
194
-
195
-
196
-
197
-
198
-
199
-
200
-
201
-
202
-
203
-
204
-
205
-
206
-
207
-
208
-
209
-
210
-
211
-
212
-
213
-
214
-
215
-
216
-
217
-
218
-
219
-
220
 |
 |
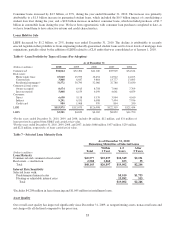
The commercial and industrial loan portfolio continues to perform well, as evidenced by improving trends in our credit
quality indicators. Delinquencies, net charge-offs, and nonperforming loans all decreased year over year within this portfolio.
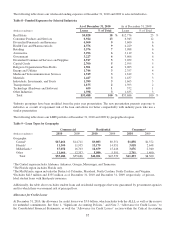
Under the post-adoption classification, our commercial real estate portfolio consists of investor-owned properties. We
believe that our investor-owned portfolio is appropriately diversified by borrower, geography, and property type. We
typically underwrite commercial projects to credit standards that are more stringent than historical CMBS guidelines. Given
the stresses in the commercial real estate market, we have performed a thorough analysis of our commercial real estate
portfolio in order to identify loans with an increased risk of default. Where appropriate, we have taken prudent actions with
the client to strengthen our credit position. These actions reflect market terms and structures and are intended to improve the
client’s financial ability to perform. Impaired loans are assessed relative to the client’s and guarantor’s, if any, abilities to
service the debt, the loan terms, and the value of the property. These factors are taken into consideration when formulating
our ALLL through our credit risk rating and/or specific reserving processes. We believe the current commercial real estate
cycle is not over, and we expect some elevated risk and variability in performance through the credit cycle. We continue to
believe that this portfolio will perform comparatively well given its composition, the quality of our underwriting, and our
ongoing management disciplines.
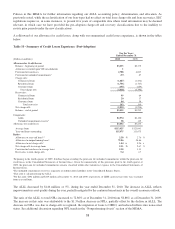
For our commercial construction portfolios, we continue to be proactive in our credit monitoring and management processes
to provide early warning for problem loans. For example, we use an expanded liquidity and contingency analysis to provide a
thorough view of borrower capacity and their ability to service obligations in a steep market decline. We also have strict
limits and exposure caps on specific projects and borrowers for risk diversification. Due to the lack of new construction
projects and the completion of many that were previously started, the aggregate amount of interest reserves that we are
obligated to fund has declined from prior periods and are not considered material relative to total loans outstanding. We
expect quarterly variability in losses as we continue to work through the remaining risk in this runoff portfolio.
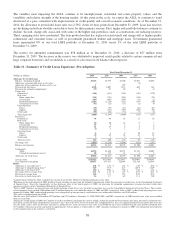
The residential mortgages portfolio continued to show overall improvement in terms of declines in NPLs and net charge-offs,
as well as stable but continued elevated delinquencies. Certain products within this portfolio are insured through third-party
pool level insurance; however, the dollar amount of claims received has declined during 2010 and we expect fewer claim
payments going forward as we approach the insurance stop loss limits. Our outlook for the residential mortgage portfolio,
based on past delinquency trends, is for reduced frequency of default over the next few quarters. We expect home prices to
remain soft overall, trending down in some markets and stable to modestly up in other markets. We believe that lower
expected default frequency and moderating loss severity will produce stable to modestly declining nonperforming loan and
charge-off levels over the near term.
Asset quality in the home equity portfolio was slightly improved during the year, while higher risk balances continued to
decline. Net charge-offs, early stage delinquencies, and nonperforming loans all showed modest year over year declines.
Runoff in this portfolio has been concentrated in the higher risk portfolios, where no new production has occurred and little
to no line availability exists.
The residential construction portfolio also showed improvement in terms of declines in NPLs and net charge-offs. Net
charge-offs are expected to remain elevated and uneven as we work through the remainder of the risk in this portfolio.
Further, while there may be some variability, we generally expect this trend of declining nonperforming loans to continue as
we aggressively pursue workouts and transition foreclosed assets to OREO, and ultimately, disposition.
For the consumer portfolios, asset quality improved during the year. For all consumer portfolios, the net charge-off ratio
declined in 2010 versus 2009. Likewise, early stage delinquencies declined across all portfolios except student loans, which
are largely government guaranteed. Meanwhile, the level of nonperforming consumer loans remained relatively flat.
We believe that our loan portfolio is well diversified by product, client, and geography throughout our footprint. However,
our loan portfolio may be exposed to certain concentrations of credit risk which exist in relation to individual borrowers or
groups of borrowers, certain types of collateral, certain types of industries, certain loan products, or certain regions of the
country. See Note 19, “Concentrations of Credit Risk,” to the Consolidated Financial Statements for more information.
36