SunTrust 2010 Annual Report Download - page 56
Download and view the complete annual report
Please find page 56 of the 2010 SunTrust annual report below. You can navigate through the pages in the report by either clicking on the pages listed below, or by using the keyword search tool below to find specific information within the annual report.-
 1
1 -
2
-
3
-
4
-
5
-
6
-
7
-
8
-
9
-
10
-
11
-
12
-
13
-
14
-
15
-
16
-
17
-
18
-
19
-
20
-
21
-
22
-
23
-
24
-
25
-
26
-
27
-
28
-
29
-
30
-
31
-
32
-
33
-
34
-
35
-
36
-
37
-
38
-
39
-
40
-
41
-
42
-
43
-
44
-
45
-
 46
46 -
 47
47 -
 48
48 -
 49
49 -
 50
50 -
 51
51 -
 52
52 -
 53
53 -
 54
54 -
 55
55 -
 56
56 -
 57
57 -
 58
58 -
 59
59 -
 60
60 -
 61
61 -
 62
62 -
 63
63 -
 64
64 -
 65
65 -
 66
66 -
67
-
68
-
69
-
70
-
71
-
72
-
73
-
74
-
75
-
76
-
77
-
78
-
79
-
80
-
81
-
82
-
83
-
84
-
85
-
86
-
87
-
88
-
89
-
90
-
91
-
92
-
93
-
94
-
95
-
96
-
97
-
98
-
99
-
100
-
101
-
102
-
103
-
104
-
105
-
106
-
107
-
108
-
109
-
110
-
111
-
112
-
113
-
114
-
115
-
116
-
117
-
118
-
119
-
120
-
121
-
122
-
123
-
124
-
125
-
126
-
127
-
128
-
129
-
130
-
131
-
132
-
133
-
134
-
135
-
136
-
137
-
138
-
139
-
140
-
141
-
142
-
143
-
144
-
145
-
146
-
147
-
148
-
149
-
150
-
151
-
152
-
153
-
154
-
155
-
156
-
157
-
158
-
159
-
160
-
161
-
162
-
163
-
164
-
165
-
166
-
167
-
168
-
169
-
170
-
171
-
172
-
173
-
174
-
175
-
176
-
177
-
178
-
179
-
180
-
181
-
182
-
183
-
184
-
185
-
186
-
187
-
188
-
189
-
190
-
191
-
192
-
193
-
194
-
195
-
196
-
197
-
198
-
199
-
200
-
201
-
202
-
203
-
204
-
205
-
206
-
207
-
208
-
209
-
210
-
211
-
212
-
213
-
214
-
215
-
216
-
217
-
218
-
219
-
220
 |
 |

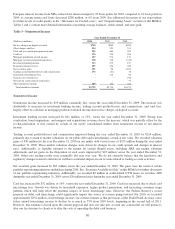
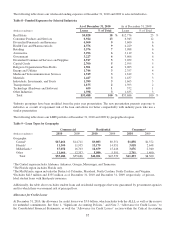
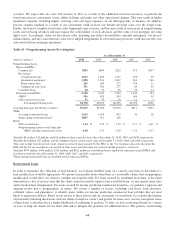
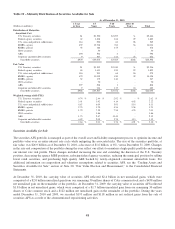
As previously noted, while the reclassification of our loan types had no effect on total loans or total ALLL, SEC regulations
require us, in some instances, to present five years of comparable data where trend information may be deemed relevant, in
which case we have provided the pre-adoption ALLL by loan type classifications due to the inability to restate prior periods
under the new classifications.
The allocation of our ALLL by loan type is shown in the tables below:
Table 12 - Allowance for Loan Losses by Loan Type (Post-Adoption)
December 31, 2010 December 31, 2009
ALLL
Loan types
asa%of
total loans ALLL
Loan types
as a % of
total loans
(Dollars in millions)
Commercial loans $1,303 46 % $1,353 49 %
Residential loans 1,498 40 1,592 41
Consumer loans 173 14 175 10
Total $2,974 100 % $3,120 100 %
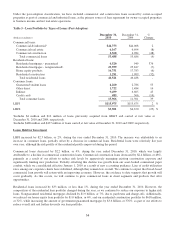
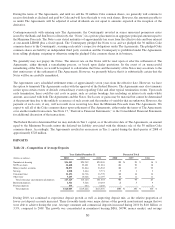
Table 13 - Allowance for Loan Losses by Loan Type (Pre-Adoption)
(Dollars in millions) As of December 31
Allocation by Loan Type 2010 2009 2008 2007 2006
Commercial loans $477 $650 $631 $423 $416
Real estate loans 2,238 2,268 1,523 664 443
Consumer loans 259 202 197 110 96
Unallocated 1-- - 85 90
Total $2,974 $3,120 $2,351 $1,282 $1,045
Year-end Loan Types as a Percent of As of December 31
Total Loans 2010 2009 2008 2007 2006
Commercial loans 29 % 29 % 32 % 29 % 29 %
Real estate loans 56 60 58 61 61
Consumer loans 15 11 10 10 10
Total 100 % 100 % 100 % 100 % 100 %
1Beginning in 2008, the unallocated reserve is reflected in our homogeneous pool estimates.
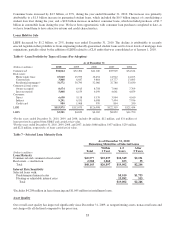
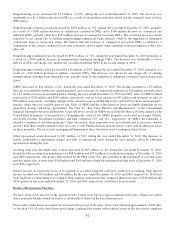
Charge-offs
Net charge-offs for the years ended December 31, 2010 and 2009 were $2.9 billion and $3.2 billion, respectively. As a
percentage of average annualized loans, net charge-offs were 2.51% and 2.67% during the years ended December 31, 2010
and 2009, respectively. Factors which could affect general asset quality and charge-off levels include macro or regional
economic volatility, specific borrower performance, and trends within specific sectors, such as construction and commercial
real estate.
Total charge-offs for the year ended December 31, 2010 declined for the majority of our loan portfolios compared to the
same period in 2009. However, commercial real estate charge-offs increased during the latter half of 2010 as specific loans
were resolved. Given continuing stress in this segment, the timing and amount of future commercial real estate charge-offs
will remain variable. For the first quarter of 2011, a stable to a modest decline in net charge-offs from fourth quarter levels is
expected.
40