SunTrust 2010 Annual Report Download - page 125
Download and view the complete annual report
Please find page 125 of the 2010 SunTrust annual report below. You can navigate through the pages in the report by either clicking on the pages listed below, or by using the keyword search tool below to find specific information within the annual report.-
 1
1 -
2
-
3
-
4
-
5
-
6
-
7
-
8
-
9
-
10
-
11
-
12
-
13
-
14
-
15
-
16
-
17
-
18
-
19
-
20
-
21
-
22
-
23
-
24
-
25
-
26
-
27
-
28
-
29
-
30
-
31
-
32
-
33
-
34
-
35
-
36
-
37
-
38
-
39
-
40
-
41
-
42
-
43
-
44
-
45
-
46
-
47
-
48
-
49
-
50
-
51
-
52
-
53
-
54
-
55
-
56
-
57
-
58
-
59
-
60
-
61
-
62
-
63
-
64
-
65
-
66
-
67
-
68
-
69
-
70
-
71
-
72
-
73
-
74
-
75
-
76
-
77
-
78
-
79
-
80
-
81
-
82
-
83
-
84
-
85
-
86
-
87
-
88
-
89
-
90
-
91
-
92
-
93
-
94
-
95
-
96
-
97
-
98
-
99
-
100
-
101
-
102
-
103
-
104
-
105
-
106
-
107
-
108
-
109
-
110
-
111
-
112
-
113
-
114
-
 115
115 -
 116
116 -
 117
117 -
 118
118 -
 119
119 -
 120
120 -
 121
121 -
 122
122 -
 123
123 -
 124
124 -
 125
125 -
 126
126 -
 127
127 -
 128
128 -
 129
129 -
 130
130 -
 131
131 -
 132
132 -
 133
133 -
 134
134 -
 135
135 -
136
-
137
-
138
-
139
-
140
-
141
-
142
-
143
-
144
-
145
-
146
-
147
-
148
-
149
-
150
-
151
-
152
-
153
-
154
-
155
-
156
-
157
-
158
-
159
-
160
-
161
-
162
-
163
-
164
-
165
-
166
-
167
-
168
-
169
-
170
-
171
-
172
-
173
-
174
-
175
-
176
-
177
-
178
-
179
-
180
-
181
-
182
-
183
-
184
-
185
-
186
-
187
-
188
-
189
-
190
-
191
-
192
-
193
-
194
-
195
-
196
-
197
-
198
-
199
-
200
-
201
-
202
-
203
-
204
-
205
-
206
-
207
-
208
-
209
-
210
-
211
-
212
-
213
-
214
-
215
-
216
-
217
-
218
-
219
-
220
 |
 |

SUNTRUST BANKS, INC.
Notes to Consolidated Financial Statements (Continued)
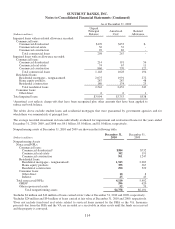
The following is a rollforward of credit losses recognized in earnings for the year ended December 31, 2010 and the nine
months ended December 31, 2009 related to securities for which some portion of the impairment was recorded in OCI:
(Dollars in millions)
Balance, as of April 1, 2009, effective date $8
Additions:
OTTI credit losses on securities not previously impaired 18
Reductions:
Credit impaired securities sold, matured, or written off (4)
Balance, as of December 31, 2009 1$22
(Dollars in millions)
Balance, as of January 1, 2010 $22
Reductions:
Increases in expected cash flows recognized over the remaining life of the securities (2)
Balance, as of December 31, 2010 2$20
1During the nine month period from the effective date to December 31, 2009, the Company recognized $2 million of OTTI through earnings on debt
securities in which no portion of the OTTI loss was included in OCI at any time during the period. OTTI related to these securities are excluded from these
amounts.
2During the year ended December 31, 2010, the Company recognized $2 million of OTTI through earnings on debt securities in which no portion of the
OTTI loss was included in OCI at any time during the period. OTTI related to these securities are excluded from these amounts.
All AFS securities are reviewed quarterly for OTTI based on the analysis of underlying cash flows. The securities that gave rise to
the credit impairment recognized during the year ended December 31, 2010 consisted of private RMBS with a fair market value of
$1 million at December 31, 2010. The securities impacted by credit impairment during the year ended December 31, 2009, were
primarily private RMBS with a fair value of approximately $311 million as of December 31, 2009. Credit impairment that is
determined through the use of cash flow models is estimated using cash flows on security specific collateral and the transaction
structure. Future expected credit losses are determined by using various assumptions, the most significant of which include current
default rates, prepayment rates, and loss severities. For the majority of the securities that the Company has reviewed for OTTI,
credit information is available and modeled at the loan level underlying each security and also considers information such as loan to
collateral values, FICO scores, and geographic considerations such as home price appreciation/depreciation. These inputs are
updated on a regular basis to ensure the most current credit and other assumptions are utilized in the analysis. If, based on this
analysis, the Company does not expect to recover the entire amortized cost basis of the security, the expected cash flows are then
discounted at the security’s initial effective interest rate to arrive at a present value amount. OTTI credit losses reflect the difference
between the present value of cash flows expected to be collected and the amortized cost basis of these securities. During the year
ended December 31, 2010 and 2009, all but an insignificant amount of credit-related OTTI recognized in earnings on private
RMBS have underlying collateral of loans originated in 2006 and 2007, the majority of which were originated by the Company and
therefore have geographic concentrations in the Company’s primary footprint.
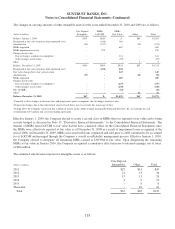
The following table presents a summary of the significant inputs used in determining the measurement of credit losses
recognized in earnings for private RMBS for the years ended December 31, 2010 and 2009:
December 31, 2010 December 31, 2009
Current default rate 2-7% 2 - 17%
Prepayment rate 14 - 22% 6 - 21%
Loss severity 37 - 46% 35 - 52%
As noted in the table, there has generally been an improvement or stabilization in all of the significant assumptions used to
evaluate the private RMBS for credit impairment. In addition, the Company has not purchased new private RMBS in securities
AFS during the year ended December 31, 2010, and continues to reduce existing exposure primarily through paydowns.
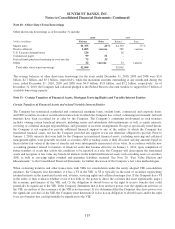
The Company held stock in the FHLB of Atlanta totaling $298 million at December 31, 2010 and $343 million of stock in
the FHLB of Atlanta and the FHLB of Cincinnati at December 31, 2009. The Company accounts for the stock based on
relevant accounting guidance, which requires the investment be carried at cost and be evaluated for impairment based on the
109