SunTrust 2010 Annual Report Download - page 175
Download and view the complete annual report
Please find page 175 of the 2010 SunTrust annual report below. You can navigate through the pages in the report by either clicking on the pages listed below, or by using the keyword search tool below to find specific information within the annual report.-
 1
1 -
2
-
3
-
4
-
5
-
6
-
7
-
8
-
9
-
10
-
11
-
12
-
13
-
14
-
15
-
16
-
17
-
18
-
19
-
20
-
21
-
22
-
23
-
24
-
25
-
26
-
27
-
28
-
29
-
30
-
31
-
32
-
33
-
34
-
35
-
36
-
37
-
38
-
39
-
40
-
41
-
42
-
43
-
44
-
45
-
46
-
47
-
48
-
49
-
50
-
51
-
52
-
53
-
54
-
55
-
56
-
57
-
58
-
59
-
60
-
61
-
62
-
63
-
64
-
65
-
66
-
67
-
68
-
69
-
70
-
71
-
72
-
73
-
74
-
75
-
76
-
77
-
78
-
79
-
80
-
81
-
82
-
83
-
84
-
85
-
86
-
87
-
88
-
89
-
90
-
91
-
92
-
93
-
94
-
95
-
96
-
97
-
98
-
99
-
100
-
101
-
102
-
103
-
104
-
105
-
106
-
107
-
108
-
109
-
110
-
111
-
112
-
113
-
114
-
115
-
116
-
117
-
118
-
119
-
120
-
121
-
122
-
123
-
124
-
125
-
126
-
127
-
128
-
129
-
130
-
131
-
132
-
133
-
134
-
135
-
136
-
137
-
138
-
139
-
140
-
141
-
142
-
143
-
144
-
145
-
146
-
147
-
148
-
149
-
150
-
151
-
152
-
153
-
154
-
155
-
156
-
157
-
158
-
159
-
160
-
161
-
162
-
163
-
164
-
 165
165 -
 166
166 -
 167
167 -
 168
168 -
 169
169 -
 170
170 -
 171
171 -
 172
172 -
 173
173 -
 174
174 -
 175
175 -
 176
176 -
 177
177 -
 178
178 -
 179
179 -
 180
180 -
 181
181 -
 182
182 -
 183
183 -
 184
184 -
 185
185 -
186
-
187
-
188
-
189
-
190
-
191
-
192
-
193
-
194
-
195
-
196
-
197
-
198
-
199
-
200
-
201
-
202
-
203
-
204
-
205
-
206
-
207
-
208
-
209
-
210
-
211
-
212
-
213
-
214
-
215
-
216
-
217
-
218
-
219
-
220
 |
 |

SUNTRUST BANKS, INC.
Notes to Consolidated Financial Statements (Continued)
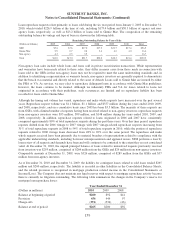
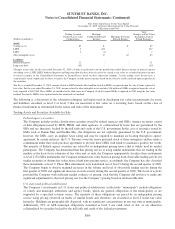
Loan repurchase requests relate primarily to loans sold during the six year period from January 1, 2005 to December 31,
2010, which totaled $226.9 billion at the time of sale, including $173.4 billion and $30.3 billion of agency and non-
agency loans, respectively, as well as $23.2 billion of loans sold to Ginnie Mae. The composition of the remaining
outstanding balance by vintage and type of buyer is shown in the following table.
Remaining Outstanding Balance by Year of Sale
(Dollars in billions) 2005 2006 2007 2008 2009 2010 Total
GSE $5.8 $7.8 $17.0 $17.2 $31.7 $17.4 $96.9
Ginnie Mae 0.9 0.7 0.8 3.6 6.6 4.0 16.6
Non-agency 6.3 6.5 3.9 - - - 16.7
Total $13.0 $15.0 $21.7 $20.8 $38.3 $21.4 $130.2
Non-agency loan sales include whole loans and loans sold in private securitization transactions. While representation
and warranties have been made related to these sales, they differ in many cases from those made in connection with
loans sold to the GSEs in that non-agency loans may not be required to meet the same underwriting standards and, in
addition to identifying a representation or warranty breach, non-agency investors are generally required to demonstrate
that the breach was material and directly related to the cause of default. Loans sold to Ginnie Mae are insured by either
the FHA or VA. As servicer, we may elect to repurchase delinquent loans in accordance with Ginnie Mae guidelines;
however, the loans continue to be insured. Although we indemnify FHA and VA for losses related to loans not
originated in accordance with their guidelines, such occurrences are limited and no repurchase liability has been
recorded for loans sold to Ginnie Mae.
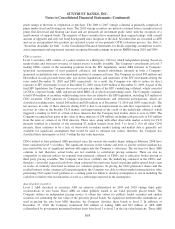
Although the timing and volume has varied, repurchase and make whole requests have increased over the past several
years. Repurchase request volume was $1.1 billion, $1.1 billion, and $557 million during the years ended 2010, 2009,
and 2008, respectively, and on a cumulative basis since 2005 has been $3.5 billion. The majority of these requests are
from GSEs, with a limited number of requests having been received related to non-agency investors; repurchase requests
from non-agency investors were $55 million, $99 million, and $148 million during the years ended 2010, 2009, and
2008, respectively. In addition, repurchase requests related to loans originated in 2006 and 2007 have consistently
comprised approximately 80% of total repurchase requests during the past three years. Over this time period, repurchase
requests shifted from the 2006 vintage to 2007 vintage with 2007 vintage-related repurchase requests increasing from
31% of total repurchase requests in 2008 to 54% of total repurchase requests in 2010, while the portion of repurchase
requests related to 2006 vintage loans decreased from 48% to 26% over the same period. The repurchase and make
whole requests received have been primarily due to material breaches of representations related to compliance with the
applicable underwriting standards, including borrower misrepresentation and appraisal issues. STM performs a loan by
loan review of all requests and demands have been and will continue to be contested to the extent they are not considered
valid. At December 31, 2010, the unpaid principal balance of loans related to unresolved requests previously received
from investors was $293 million, comprised of $264 million from the GSEs and $29 million from non-agency investors.
Comparable amounts at December 31, 2009, were $326 million, comprised of $289 million from the GSEs and $37
million from non-agency investors.
As of December 31, 2010 and December 31, 2009, the liability for contingent losses related to sold loans totaled $265
million and $200 million, respectively. The liability is recorded in other liabilities in the Consolidated Balance Sheets,
and the related provision is recognized in mortgage production related income in the Consolidated Statements of
Income/(Loss). The Company does not maintain any legal reserves with respect to mortgage repurchase activity because
there is currently no litigation outstanding. The following table summarizes the changes in the Company’s reserve for
mortgage loan repurchase losses:
Year Ended December 31
(Dollars in millions) 2010 2009 2008
Balance at beginning of period $200 $92 $41
Provision 456 444 97
Charge-offs (391) (336) (46)
Balance at end of period $265 $200 $92
159