SunTrust 2010 Annual Report Download - page 67
Download and view the complete annual report
Please find page 67 of the 2010 SunTrust annual report below. You can navigate through the pages in the report by either clicking on the pages listed below, or by using the keyword search tool below to find specific information within the annual report.-
 1
1 -
2
-
3
-
4
-
5
-
6
-
7
-
8
-
9
-
10
-
11
-
12
-
13
-
14
-
15
-
16
-
17
-
18
-
19
-
20
-
21
-
22
-
23
-
24
-
25
-
26
-
27
-
28
-
29
-
30
-
31
-
32
-
33
-
34
-
35
-
36
-
37
-
38
-
39
-
40
-
41
-
42
-
43
-
44
-
45
-
46
-
47
-
48
-
49
-
50
-
51
-
52
-
53
-
54
-
55
-
56
-
 57
57 -
 58
58 -
 59
59 -
 60
60 -
 61
61 -
 62
62 -
 63
63 -
 64
64 -
 65
65 -
 66
66 -
 67
67 -
 68
68 -
 69
69 -
 70
70 -
 71
71 -
 72
72 -
 73
73 -
 74
74 -
 75
75 -
 76
76 -
 77
77 -
78
-
79
-
80
-
81
-
82
-
83
-
84
-
85
-
86
-
87
-
88
-
89
-
90
-
91
-
92
-
93
-
94
-
95
-
96
-
97
-
98
-
99
-
100
-
101
-
102
-
103
-
104
-
105
-
106
-
107
-
108
-
109
-
110
-
111
-
112
-
113
-
114
-
115
-
116
-
117
-
118
-
119
-
120
-
121
-
122
-
123
-
124
-
125
-
126
-
127
-
128
-
129
-
130
-
131
-
132
-
133
-
134
-
135
-
136
-
137
-
138
-
139
-
140
-
141
-
142
-
143
-
144
-
145
-
146
-
147
-
148
-
149
-
150
-
151
-
152
-
153
-
154
-
155
-
156
-
157
-
158
-
159
-
160
-
161
-
162
-
163
-
164
-
165
-
166
-
167
-
168
-
169
-
170
-
171
-
172
-
173
-
174
-
175
-
176
-
177
-
178
-
179
-
180
-
181
-
182
-
183
-
184
-
185
-
186
-
187
-
188
-
189
-
190
-
191
-
192
-
193
-
194
-
195
-
196
-
197
-
198
-
199
-
200
-
201
-
202
-
203
-
204
-
205
-
206
-
207
-
208
-
209
-
210
-
211
-
212
-
213
-
214
-
215
-
216
-
217
-
218
-
219
-
220
 |
 |

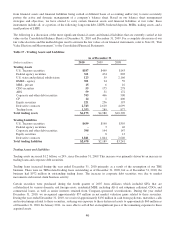
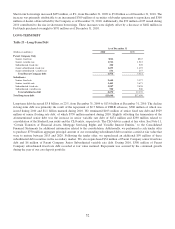
accounts which increased $10.3 billion, or 12%. The increase was partially offset by declines in consumer time and other
time deposit account balances which decreased by $6.3 billion, or 21%. These positive trends resulted from our continued
marketing efforts, pricing discipline in the context of a low and declining rate environment, improving operational execution,
as well as an industry-wide preference for greater liquidity.
Consumer and commercial deposit growth remains one of our key initiatives. During 2010, we focused on growing our client
base, number of households, and deposit share while managing the rates we pay on our deposits. Overall growth was
accomplished through a judicious use of competitive rates in select products and select geographies. We experienced mixed
results across our 16 regions due to competitive forces, unusual deposit flows resulting from the FDIC’s TAGP, and
concentrations of time deposit clients. Other initiatives to attract deposits included innovative product and features offerings,
enhanced programs and initiatives, customer-targeted offers, and advanced analytics that leverage product offerings with
customer segmentation. We continued to leverage the “Live Solid. Bank Solid.” brand to improve our visibility in the
marketplace. It is designed to speak to what is important to clients in the current environment and to inspire customer loyalty
and capitalize on some of the opportunities presented by the new banking landscape. We continue to manage judiciously
through the implications of impending or executed regulatory change and evaluate the impacts to our deposit products and
clients. Average brokered and foreign deposits decreased by $3.2 billion, or 52%, during 2010 compared to 2009. This
decrease was due to our ability to grow deposits and, in turn, reduce our reliance upon wholesale funding sources. As of
December 31, 2010 securities pledged as collateral for deposits totaled $3.9 billion.
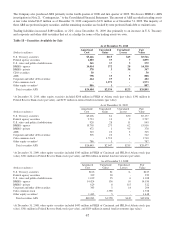
Table 21 – Maturity of Consumer Time and Other Time Deposits in Amounts of $100,000 or More
At December 31, 2010
(Dollars in millions)
Consumer
Time
Brokered
Time
Foreign
Time Total
Months to maturity:
3 or less $1,558 $140 $654 $2,352
Over 3 through 6 953 29 - 982
Over 6 through 12 2,016 52 - 2,068
Over 12 3,115 2,144 - 5,259
Total $7,642 $2,365 $654 $10,661
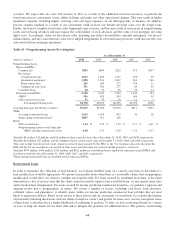
SHORT-TERM BORROWINGS
Table 22 – Short-Term Borrowings
As of December 31 Daily Average
Maximum
Outstanding
at any
Month-End(Dollars in millions) Balance Rate Balance Rate
2010
Federal funds purchased ¹ $951 0.18 % $1,226 0.19 % $3,163
Securities sold under agreement to repurchase ¹ 2,180 0.17 2,416 0.15 2,830
CP issued 99 0.62 458 0.48 1,009
Other short-term borrowings 2,591 0.71 2,556 0.42 4,608
2009
Federal funds purchased ¹ $1,433 0.15 % $1,670 0.19 % $3,920
Securities sold under agreement to repurchase ¹ 1,871 0.11 2,483 0.18 3,333
CP issued - N/A 15 0.40 150
Other short-term borrowings 2,062 1.08 2,689 0.54 5,676
2008
Federal funds purchased ¹ $1,120 0.32 % $2,622 1.96 % $5,693
Securities sold under agreement to repurchase ¹ 3,193 0.19 4,961 1.59 6,318
CP issued - N/A 52 2.40 148
Other short-term borrowings 5,166 0.48 3,005 1.79 5,166
1Federal funds purchased and securities sold under agreements to repurchase mature overnight or at a fixed maturity generally not exceeding three
months. Rates on overnight funds reflect current market rates. Rates on fixed maturity borrowings are set at the time of borrowings.
51