SunTrust 2010 Annual Report Download - page 193
Download and view the complete annual report
Please find page 193 of the 2010 SunTrust annual report below. You can navigate through the pages in the report by either clicking on the pages listed below, or by using the keyword search tool below to find specific information within the annual report.-
 1
1 -
2
-
3
-
4
-
5
-
6
-
7
-
8
-
9
-
10
-
11
-
12
-
13
-
14
-
15
-
16
-
17
-
18
-
19
-
20
-
21
-
22
-
23
-
24
-
25
-
26
-
27
-
28
-
29
-
30
-
31
-
32
-
33
-
34
-
35
-
36
-
37
-
38
-
39
-
40
-
41
-
42
-
43
-
44
-
45
-
46
-
47
-
48
-
49
-
50
-
51
-
52
-
53
-
54
-
55
-
56
-
57
-
58
-
59
-
60
-
61
-
62
-
63
-
64
-
65
-
66
-
67
-
68
-
69
-
70
-
71
-
72
-
73
-
74
-
75
-
76
-
77
-
78
-
79
-
80
-
81
-
82
-
83
-
84
-
85
-
86
-
87
-
88
-
89
-
90
-
91
-
92
-
93
-
94
-
95
-
96
-
97
-
98
-
99
-
100
-
101
-
102
-
103
-
104
-
105
-
106
-
107
-
108
-
109
-
110
-
111
-
112
-
113
-
114
-
115
-
116
-
117
-
118
-
119
-
120
-
121
-
122
-
123
-
124
-
125
-
126
-
127
-
128
-
129
-
130
-
131
-
132
-
133
-
134
-
135
-
136
-
137
-
138
-
139
-
140
-
141
-
142
-
143
-
144
-
145
-
146
-
147
-
148
-
149
-
150
-
151
-
152
-
153
-
154
-
155
-
156
-
157
-
158
-
159
-
160
-
161
-
162
-
163
-
164
-
165
-
166
-
167
-
168
-
169
-
170
-
171
-
172
-
173
-
174
-
175
-
176
-
177
-
178
-
179
-
180
-
181
-
182
-
 183
183 -
 184
184 -
 185
185 -
 186
186 -
 187
187 -
 188
188 -
 189
189 -
 190
190 -
 191
191 -
 192
192 -
 193
193 -
 194
194 -
 195
195 -
 196
196 -
 197
197 -
 198
198 -
 199
199 -
 200
200 -
 201
201 -
 202
202 -
 203
203 -
204
-
205
-
206
-
207
-
208
-
209
-
210
-
211
-
212
-
213
-
214
-
215
-
216
-
217
-
218
-
219
-
220
 |
 |

SUNTRUST BANKS, INC.
Notes to Consolidated Financial Statements (Continued)
Fair Value Measurement at
December 31, 2010
Using
(Dollars in millions)
Net
Carrying
Value
Quoted Prices in
Active Markets
for Identical
Assets/Liabilities
(Level 1)
Significant
Other
Observable
Inputs
(Level 2)
Significant
Unobservable
Inputs
(Level 3)
Valuation
Allowance
LHFS $333 $- $142 $191 $-
LHFI 85 - - 85 (15)
OREO 596 - 553 43 (116)
Affordable Housing 357 - - 357 -
Other Assets 130 - 90 40 (20)
Fair Value Measurement at
December 31, 2009,
Using
(Dollars in millions)
Net
Carrying
Value
Quoted Prices in
Active Markets
for Identical
Assets/Liabilities
(Level 1)
Significant
Other
Observable
Inputs
(Level 2)
Significant
Unobservable
Inputs
(Level 3)
Valuation
Allowance
LHFS $1,339 $- $1,173 $166 ($48)
LHFI 96 - 96 - (16)
MSRs 23 - - 23 (7)
OREO 620 - 496 124 (110)
Affordable Housing 395 - - 395 -
Other Assets 144 - 61 83 -
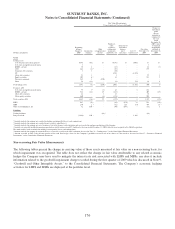
The following is a discussion of the valuation techniques and inputs used in developing fair value measurements for assets
classified as level 2 or level 3 that are measured at fair value on a non-recurring basis, based on the class as determined by
the nature and risks of the instrument. The valuation techniques used for the MSRs accounted for at amortized cost during
2009 are the same as those previously discussed in the Recurring Fair Value Measurement section of this footnote.
Loans Held for Sale
Level 2 LHFS consist primarily of conforming residential mortgage loans and corporate loans that are accounted for at
LOCOM. Level 3 LHFS consist of non-agency residential mortgage LHFS for which there is little or no secondary market
activity and leases held for sale. These loans are valued consistent with the methodology discussed in the Recurring Fair
Value Measurement section of this footnote. Leases held for sale are valued using internal estimates which incorporate
market data when available. Due to the lack of current market data for comparable leases, these assets are considered level 3.
During the year ended December 31, 2010, the Company transferred $160 million of NPLs that were previously designated
as LHFI to LHFS that were subsequently sold at prices that approximated fair value. These loans were predominantly
reported at amortized cost prior to transferring to LHFS; however, a portion of the NPLs was carried at fair value. There were
no similar transfers during the year ended December 31, 2009.
Loans Held for Investment
LHFI consist primarily of nonperforming CRE loans for which specific reserves have been recorded. As these loans have
been classified as nonperforming, cash proceeds from the sale of the underlying collateral is the expected source of
repayment for a majority of these loans. Accordingly, the fair value of these loans is derived from internal estimates of the
underlying collateral incorporating market data when available. Due to the lack of market data for similar assets, these loans
are considered level 3.
177