SunTrust 2010 Annual Report Download - page 83
Download and view the complete annual report
Please find page 83 of the 2010 SunTrust annual report below. You can navigate through the pages in the report by either clicking on the pages listed below, or by using the keyword search tool below to find specific information within the annual report.-
 1
1 -
2
-
3
-
4
-
5
-
6
-
7
-
8
-
9
-
10
-
11
-
12
-
13
-
14
-
15
-
16
-
17
-
18
-
19
-
20
-
21
-
22
-
23
-
24
-
25
-
26
-
27
-
28
-
29
-
30
-
31
-
32
-
33
-
34
-
35
-
36
-
37
-
38
-
39
-
40
-
41
-
42
-
43
-
44
-
45
-
46
-
47
-
48
-
49
-
50
-
51
-
52
-
53
-
54
-
55
-
56
-
57
-
58
-
59
-
60
-
61
-
62
-
63
-
64
-
65
-
66
-
67
-
68
-
69
-
70
-
71
-
72
-
 73
73 -
 74
74 -
 75
75 -
 76
76 -
 77
77 -
 78
78 -
 79
79 -
 80
80 -
 81
81 -
 82
82 -
 83
83 -
 84
84 -
 85
85 -
 86
86 -
 87
87 -
 88
88 -
 89
89 -
 90
90 -
 91
91 -
 92
92 -
 93
93 -
94
-
95
-
96
-
97
-
98
-
99
-
100
-
101
-
102
-
103
-
104
-
105
-
106
-
107
-
108
-
109
-
110
-
111
-
112
-
113
-
114
-
115
-
116
-
117
-
118
-
119
-
120
-
121
-
122
-
123
-
124
-
125
-
126
-
127
-
128
-
129
-
130
-
131
-
132
-
133
-
134
-
135
-
136
-
137
-
138
-
139
-
140
-
141
-
142
-
143
-
144
-
145
-
146
-
147
-
148
-
149
-
150
-
151
-
152
-
153
-
154
-
155
-
156
-
157
-
158
-
159
-
160
-
161
-
162
-
163
-
164
-
165
-
166
-
167
-
168
-
169
-
170
-
171
-
172
-
173
-
174
-
175
-
176
-
177
-
178
-
179
-
180
-
181
-
182
-
183
-
184
-
185
-
186
-
187
-
188
-
189
-
190
-
191
-
192
-
193
-
194
-
195
-
196
-
197
-
198
-
199
-
200
-
201
-
202
-
203
-
204
-
205
-
206
-
207
-
208
-
209
-
210
-
211
-
212
-
213
-
214
-
215
-
216
-
217
-
218
-
219
-
220
 |
 |
been incurred or to estimate the ultimate or minimum amount of that liability until the matter is close to resolution. As
additional information becomes available, we reassess the potential liability related to pending claims and may revise our
estimates.
Due to the inherent uncertainties of the legal and regulatory processes in the multiple jurisdictions in which we operate, our
estimates may be materially different than the actual outcomes, which could have material effects on our business, financial
conditions and results of operations. However, it is the opinion of management that liabilities arising from these claims in
excess of the amounts currently accrued, if any, will not have a material adverse impact to the Company’s financial
condition, results of operations, or cash flows. See Note 21, “Contingencies,” to the Consolidated Financial Statements for
further discussion.
Estimates of Fair Value
Fair value is the price that could be received to sell an asset or paid to transfer a liability in an orderly transaction between
market participants. Certain of our assets and liabilities are measured at fair value on a recurring basis. Examples of recurring
uses of fair value include derivative instruments, AFS and trading securities, certain LHFI and LHFS, certain issuances of
long-term debt, and MSRs. We also measure certain assets at fair value on a non-recurring basis either when such assets are
carried at the LOCOM, to evaluate assets for impairment, or for disclosure purposes. Examples of these non-recurring uses of
fair value include certain LHFS, OREO, goodwill, intangible assets, nonmarketable equity securities, and long-lived assets.
Depending on the nature of the asset or liability, we use various valuation techniques and assumptions when estimating fair
value.
The objective of fair value is to use market-based inputs or assumptions, when available, to estimate the price that would be
received to sell an asset or paid to transfer a liability in an orderly transaction between market participants at the
measurement date. Where observable market prices from transactions for identical assets or liabilities are not available, we
identify what we believe to be similar assets or liabilities. If observable market prices are unavailable or impracticable to
obtain for any such similar assets or liabilities, we look to other techniques such as obtaining third party quotes or using
modeling techniques, such as discounted cash flows, while attempting to utilize market observable assumptions to the extent
available. Absent current market activity in that specific security or a similar security, the resulting valuation approach will
require making a number of significant judgments in the estimation of fair value. Market conditions during the credit crisis
led to limited or nonexistent trading in certain of the financial asset classes that we have owned. The lack of liquidity and low
level of activity in these markets creates additional challenges when estimating the fair value of related financial instruments.
Generally, the assets and liabilities most affected by the lack of liquidity are those required to be classified as level 3 in the
fair value hierarchy. As a result, various processes and controls have been adopted to determine that appropriate
methodologies, techniques and assumptions are used in the development of fair value estimates, particularly related to those
instruments that require the use of significant, unobservable inputs. We continue to maintain a cross-functional approach
when estimating the fair value of these difficult to value financial instruments. This includes input from not only the related
line of business, but also from risk management and finance, to ultimately arrive at a consensus estimate of the instrument’s
fair value after evaluating all available information pertaining to fair value. This process has involved the gathering of
multiple sources of information, including broker quotes, values provided by pricing services, trading activity in other similar
securities, market indices, pricing matrices along with employing various modeling techniques, such as discounted cash flow
analyses, in arriving at the best estimate of fair value. Modeling techniques incorporate our assessments regarding
assumptions that market participants would use in pricing the asset or the liability, including market-based assumptions, such
as interest rates, as well as assumptions about the risks inherent in a particular valuation technique, the effect of a restriction
on the sale or use of an asset, market liquidity, and the risk of nonperformance. In certain cases, our assessments with respect
to assumptions that market participants would make may be inherently difficult to determine and the use of different
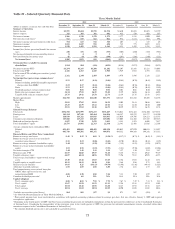
assumptions could result in material changes to these fair value measurements. We used significant unobservable inputs to
fair value, on a recurring basis, certain trading assets, securities AFS, portfolio loans accounted for at fair value, IRLCs,
LHFS, MSRs and certain derivatives. The following table discloses assets and liabilities that have been impacted by level 3
fair value determinations.
67