SunTrust 2010 Annual Report Download - page 90
Download and view the complete annual report
Please find page 90 of the 2010 SunTrust annual report below. You can navigate through the pages in the report by either clicking on the pages listed below, or by using the keyword search tool below to find specific information within the annual report.-
 1
1 -
2
-
3
-
4
-
5
-
6
-
7
-
8
-
9
-
10
-
11
-
12
-
13
-
14
-
15
-
16
-
17
-
18
-
19
-
20
-
21
-
22
-
23
-
24
-
25
-
26
-
27
-
28
-
29
-
30
-
31
-
32
-
33
-
34
-
35
-
36
-
37
-
38
-
39
-
40
-
41
-
42
-
43
-
44
-
45
-
46
-
47
-
48
-
49
-
50
-
51
-
52
-
53
-
54
-
55
-
56
-
57
-
58
-
59
-
60
-
61
-
62
-
63
-
64
-
65
-
66
-
67
-
68
-
69
-
70
-
71
-
72
-
73
-
74
-
75
-
76
-
77
-
78
-
79
-
 80
80 -
 81
81 -
 82
82 -
 83
83 -
 84
84 -
 85
85 -
 86
86 -
 87
87 -
 88
88 -
 89
89 -
 90
90 -
 91
91 -
 92
92 -
 93
93 -
 94
94 -
 95
95 -
 96
96 -
 97
97 -
 98
98 -
 99
99 -
 100
100 -
101
-
102
-
103
-
104
-
105
-
106
-
107
-
108
-
109
-
110
-
111
-
112
-
113
-
114
-
115
-
116
-
117
-
118
-
119
-
120
-
121
-
122
-
123
-
124
-
125
-
126
-
127
-
128
-
129
-
130
-
131
-
132
-
133
-
134
-
135
-
136
-
137
-
138
-
139
-
140
-
141
-
142
-
143
-
144
-
145
-
146
-
147
-
148
-
149
-
150
-
151
-
152
-
153
-
154
-
155
-
156
-
157
-
158
-
159
-
160
-
161
-
162
-
163
-
164
-
165
-
166
-
167
-
168
-
169
-
170
-
171
-
172
-
173
-
174
-
175
-
176
-
177
-
178
-
179
-
180
-
181
-
182
-
183
-
184
-
185
-
186
-
187
-
188
-
189
-
190
-
191
-
192
-
193
-
194
-
195
-
196
-
197
-
198
-
199
-
200
-
201
-
202
-
203
-
204
-
205
-
206
-
207
-
208
-
209
-
210
-
211
-
212
-
213
-
214
-
215
-
216
-
217
-
218
-
219
-
220
 |
 |

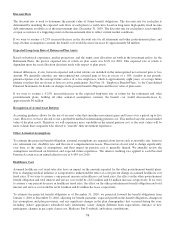
Discount Rate
The discount rate is used to determine the present value of future benefit obligations. The discount rate for each plan is
determined by matching the expected cash flows of each plan to a yield curve based on long-term, high quality fixed income
debt instruments available as of the measurement date, December 31, 2010. The discount rate for each plan is reset annually
or upon occurrence of a triggering event on the measurement date to reflect current market conditions.
If we were to assume a 0.25% increase/decrease in the discount rate for all retirement and other postretirement plans, and
keep all other assumptions constant, the benefit cost would decrease/ increase by approximately $8 million.
Expected Long-term Rate of Return on Plan Assets
Based on historical experience, market projections, and the target asset allocation set forth in the investment policy for the
Retirement Plans, the pre-tax expected rate of return on plan assets was 8.0% for 2010. This expected rate of return is
dependent upon the asset allocation decisions made with respect to plan assets.
Annual differences, if any, between expected and actual returns are included in the unrecognized net actuarial gain or loss
amount. We generally amortize any unrecognized net actuarial gain or loss in excess of a 10% corridor in net periodic
pension expense over the average future service of active employees, which is approximately eight years, or average future
lifetime for plans that are frozen or have no active participants. See Note 16, “Employee Benefit Plans,” to the Consolidated
Financial Statements for details on changes in the pension benefit obligation and the fair value of plan assets.
If we were to assume a 0.25% increase/decrease in the expected long-term rate of return for the retirement and other
postretirement plans, holding all other actuarial assumptions constant, the benefit cost would decrease/increase by
approximately $6 million.
Recognition of Actual Asset Returns
Accounting guidance allows for the use of an asset value that smoothes investment gains and losses over a period up to five
years. However, we have elected to use a preferable method in determining pension cost. This method uses the actual market
value of the plan assets. Therefore, we will experience more variability in the annual pension cost, as the asset values will be
more volatile than companies who elected to “smooth” their investment experience.
Other Actuarial Assumptions
To estimate the projected benefit obligation, actuarial assumptions are required about factors such as mortality rate, turnover
rate, retirement rate, disability rate, and the rate of compensation increases. These factors do not tend to change significantly
over time, so the range of assumptions, and their impact on pension cost, is generally limited. We annually review the
assumptions used based on historical and expected future experience. The interest crediting rate applied to each Personal
Pension Account was an annual effective rate of 4.49% for 2010.
Healthcare Cost
Assumed healthcare cost trend rates also have an impact on the amounts reported for the other postretirement benefit plans.
Due to changing medical inflation, it is important to understand the effect of a one percent change in assumed healthcare cost
trend rates. If we were to assume a one percent increase in healthcare cost trend rates, the effect on the other postretirement
benefit obligation and total interest and service cost would be a $12 million and $1 million increase, respectively. If we were
to assume a one percent decrease in healthcare trend rates, the effect on the other postretirement benefit obligation and total
interest and service cost would be an $11 million and $1 million decrease, respectively.
To estimate the projected benefit obligation as of December 31, 2010, we projected forward the benefit obligations from
January 1, 2010 to December 31, 2010, adjusting for benefit payments, expected growth in the benefit obligations, changes in
key assumptions and plan provisions, and any significant changes in the plan demographics that occurred during the year,
including (where appropriate) subsidized early retirements, salary changes different from expectations, entrance of new
participants, changes in per capita claims cost, Medicare Part D subsidy, and retiree contributions.
74