SunTrust 2010 Annual Report Download - page 46
Download and view the complete annual report
Please find page 46 of the 2010 SunTrust annual report below. You can navigate through the pages in the report by either clicking on the pages listed below, or by using the keyword search tool below to find specific information within the annual report.-
 1
1 -
2
-
3
-
4
-
5
-
6
-
7
-
8
-
9
-
10
-
11
-
12
-
13
-
14
-
15
-
16
-
17
-
18
-
19
-
20
-
21
-
22
-
23
-
24
-
25
-
26
-
27
-
28
-
29
-
30
-
31
-
32
-
33
-
34
-
35
-
 36
36 -
 37
37 -
 38
38 -
 39
39 -
 40
40 -
 41
41 -
 42
42 -
 43
43 -
 44
44 -
 45
45 -
 46
46 -
 47
47 -
 48
48 -
 49
49 -
 50
50 -
 51
51 -
 52
52 -
 53
53 -
 54
54 -
 55
55 -
 56
56 -
57
-
58
-
59
-
60
-
61
-
62
-
63
-
64
-
65
-
66
-
67
-
68
-
69
-
70
-
71
-
72
-
73
-
74
-
75
-
76
-
77
-
78
-
79
-
80
-
81
-
82
-
83
-
84
-
85
-
86
-
87
-
88
-
89
-
90
-
91
-
92
-
93
-
94
-
95
-
96
-
97
-
98
-
99
-
100
-
101
-
102
-
103
-
104
-
105
-
106
-
107
-
108
-
109
-
110
-
111
-
112
-
113
-
114
-
115
-
116
-
117
-
118
-
119
-
120
-
121
-
122
-
123
-
124
-
125
-
126
-
127
-
128
-
129
-
130
-
131
-
132
-
133
-
134
-
135
-
136
-
137
-
138
-
139
-
140
-
141
-
142
-
143
-
144
-
145
-
146
-
147
-
148
-
149
-
150
-
151
-
152
-
153
-
154
-
155
-
156
-
157
-
158
-
159
-
160
-
161
-
162
-
163
-
164
-
165
-
166
-
167
-
168
-
169
-
170
-
171
-
172
-
173
-
174
-
175
-
176
-
177
-
178
-
179
-
180
-
181
-
182
-
183
-
184
-
185
-
186
-
187
-
188
-
189
-
190
-
191
-
192
-
193
-
194
-
195
-
196
-
197
-
198
-
199
-
200
-
201
-
202
-
203
-
204
-
205
-
206
-
207
-
208
-
209
-
210
-
211
-
212
-
213
-
214
-
215
-
216
-
217
-
218
-
219
-
220
 |
 |

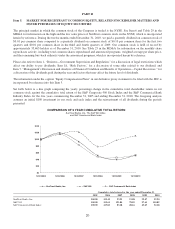
Foregone interest income from NPLs reduced net interest margin by 20 basis points for 2010, compared to 21 basis points in
2009, as average nonaccrual loans decreased $280 million, or 6% from 2009. See additional discussion of our expectations
for future levels of credit quality in the “Allowance for Credit Losses”, and “Nonperforming Assets” sections of this MD&A.
Tables 1 and 2 contain more detailed information concerning average balances, yields earned, and rates paid.
Table 3 - Noninterest Income
Year Ended December 31
(Dollars in millions) 2010 2009 2008
Service charges on deposit accounts $760 $848 $904
Other charges and fees 534 523 511
Trust and investment management income 503 486 592
Card fees 376 324 308
Mortgage production related income 127 376 171
Mortgage servicing related income/(loss) 358 330 (212)
Investment banking income 313 272 237
Retail investment services 205 218 289
Net securities gains 191 98 1,073
Trading account profits/(losses) and commissions 173 (41) 38
Gain from ownership in Visa -112 86
Gain on sale of businesses -- 198
Net gain on sale/leaseback of premises --37
Other noninterest income 189 164 241
Total noninterest income $3,729 $3,710 $4,473
Noninterest Income
Noninterest income increased by $19 million, essentially flat, versus the year ended December 31, 2009. The increase was
attributable to increases in investment banking income, trading account profits/(losses) and commissions, and card fees,
largely offset by a decline in mortgage production related income and service charges on deposit accounts.
Investment banking income increased by $41 million, or 15%, versus the year ended December 31, 2009. Strong loan
syndication, bond originations, and mergers and acquisitions revenues drove the increase, which was partially offset by the
re-characterization of fees earned by certain of our newly consolidated entities from noninterest income to net interest
income.
Trading account profits/(losses) and commissions improved during the year ended December 31, 2010 by $214 million,
primarily due to mark to market valuations on our public debt and related hedges carried at fair value. We recorded valuation
gains of $36 million for the year December 31, 2010 on our public debt versus losses of $153 million during the year ended
December 31, 2009. These market valuation changes were driven by changes in our credit spreads and changes in interest
rates. Additionally, as liquidity returned to the market for certain illiquid assets, including ARS, net market valuation
adjustments and net gains on the disposition of such assets improved by $47 million versus the year ended December 31,
2009. Other core trading results were essentially flat year over year. We do not currently believe that the legislative and
regulatory changes related to derivatives will have a material impact on our revenue related to trading account activities.
Net securities gains increased by $93 million versus the year ended December 31, 2009. The gains were the result of certain
portfolio repositioning initiatives undertaken during 2010. See “Securities Available for Sale” in this MD&A for further discussion
of our portfolio repositioning initiatives. Additionally, we recorded $2 million in credit-related OTTI losses on securities AFS
during the year ended December 31, 2010 versus $20 million in losses during the year ended December 31, 2009.
Card fees increased by $52 million, or 16%, versus the year ended December 31, 2009. Card fees increased due to check card
interchange fees. Growth was driven by household expansion, higher product penetration, and increasing consumer usage
patterns which will help offset the potential impact of lower interchange rates. However, the Federal Reserve’s recent
proposal on debit card interchange could significantly impact this source of revenue going forward. For 2010, we recorded
approximately $332 million of interchange income; our current estimate is that provisions of the Dodd-Frank Act may cause
future annual interchange income to decline by as much as 75% from 2010 levels, beginning in the second half of 2011.
However, this estimate is based upon the current proposal and does not take into account any actions that we will pursue to
alter our fee structure to clients or to alter the costs of operating the debit card business.
30