SunTrust 2010 Annual Report Download - page 41
Download and view the complete annual report
Please find page 41 of the 2010 SunTrust annual report below. You can navigate through the pages in the report by either clicking on the pages listed below, or by using the keyword search tool below to find specific information within the annual report.-
 1
1 -
2
-
3
-
4
-
5
-
6
-
7
-
8
-
9
-
10
-
11
-
12
-
13
-
14
-
15
-
16
-
17
-
18
-
19
-
20
-
21
-
22
-
23
-
24
-
25
-
26
-
27
-
28
-
29
-
30
-
 31
31 -
 32
32 -
 33
33 -
 34
34 -
 35
35 -
 36
36 -
 37
37 -
 38
38 -
 39
39 -
 40
40 -
 41
41 -
 42
42 -
 43
43 -
 44
44 -
 45
45 -
 46
46 -
 47
47 -
 48
48 -
 49
49 -
 50
50 -
 51
51 -
52
-
53
-
54
-
55
-
56
-
57
-
58
-
59
-
60
-
61
-
62
-
63
-
64
-
65
-
66
-
67
-
68
-
69
-
70
-
71
-
72
-
73
-
74
-
75
-
76
-
77
-
78
-
79
-
80
-
81
-
82
-
83
-
84
-
85
-
86
-
87
-
88
-
89
-
90
-
91
-
92
-
93
-
94
-
95
-
96
-
97
-
98
-
99
-
100
-
101
-
102
-
103
-
104
-
105
-
106
-
107
-
108
-
109
-
110
-
111
-
112
-
113
-
114
-
115
-
116
-
117
-
118
-
119
-
120
-
121
-
122
-
123
-
124
-
125
-
126
-
127
-
128
-
129
-
130
-
131
-
132
-
133
-
134
-
135
-
136
-
137
-
138
-
139
-
140
-
141
-
142
-
143
-
144
-
145
-
146
-
147
-
148
-
149
-
150
-
151
-
152
-
153
-
154
-
155
-
156
-
157
-
158
-
159
-
160
-
161
-
162
-
163
-
164
-
165
-
166
-
167
-
168
-
169
-
170
-
171
-
172
-
173
-
174
-
175
-
176
-
177
-
178
-
179
-
180
-
181
-
182
-
183
-
184
-
185
-
186
-
187
-
188
-
189
-
190
-
191
-
192
-
193
-
194
-
195
-
196
-
197
-
198
-
199
-
200
-
201
-
202
-
203
-
204
-
205
-
206
-
207
-
208
-
209
-
210
-
211
-
212
-
213
-
214
-
215
-
216
-
217
-
218
-
219
-
220
 |
 |
Financial performance
While 2010 will be remembered as a year of challenge and change for our industry, we persevered through the economic and
regulatory uncertainties and achieved improved financial performance compared to 2009.
•We returned to profitability during 2010 with a profit before payment of preferred dividends;
•Our low-cost deposits grew 10%, demonstrating our success in increasing client loyalty and growing market
share;
•Revenue expanded and benefitted from a 34 basis point expansion in net interest margin and solid performance
from several of our key businesses;
•Credit quality improved throughout the year led by declines in net charge-offs, delinquencies, and
nonperforming assets;
•Capital ratios remained strong and expanded.
Throughout this economic cycle, we maintained our focus on serving our clients and managing our core business to drive
better bottom line results. This focus, together with improved credit quality, resulted in net income of $189 million in 2010
compared to a net loss of $1.6 billion in 2009, which included a $751 million non-cash goodwill impairment charge as well
as recessionary conditions causing elevated credit losses. Net loss available to common shareholders in 2010 was $87
million, or $0.18 per average common diluted share, which compares favorably to the net loss available to common
shareholders of $1.7 billion, or $3.98 per average common share in 2009. We are pleased with the diversity of our revenue
sources and continued improvement in credit quality that is driving our improved financial performance. Although our results
for the year are still not near the level where we would like them to be, we are pleased with the progress that we made over
the course of 2010 and our position as we enter 2011.
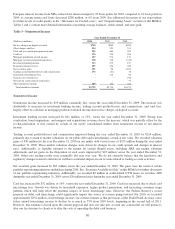
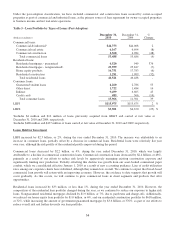
Asset quality improvement was broad-based in 2010, with improvements in the provision for credit losses, net charge-offs,
NPLs, nonperforming assets, and early stage delinquencies. The ALLL remains elevated by historical standards at 2.58% of
total loans, but declined 18 basis points compared to December 31, 2009, in part due to a $2.3 billion increase in period end
loans coupled with a $146 million decrease in the ALLL due to improving asset quality trends and a reduction in the risk
profile of our loan portfolio. While we experienced a reduction during the year in higher risk loan portfolio balances coupled
with a broad based improvement in asset quality indicators, we are maintaining reserves that give consideration to the
continued economic and real estate value uncertainty, but expect the ALLL to continue to trend downward at a pace
consistent with improvements in credit quality. The provision for credit losses decreased $1.4 billion compared to 2009 while
net charge-offs declined 12% during that time. For the first quarter of 2011, a stable to a modest decline in net charge-offs
from fourth quarter levels is expected. Total NPLs declined 24% from 2009 as a result of charge-offs, transfers to OREO,
and reduced inflows into nonaccrual. In addition, OREO declined 4% during the year as we continue to aggressively dispose
of properties once we have clear title. We expect NPLs and nonperforming assets to continue to modestly decline in the near-
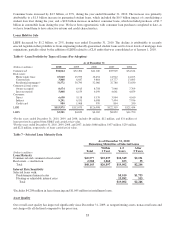
term, subject to economic conditions remaining stable or improving. Our accruing restructured loan portfolio, which is
primarily related to mortgage and consumer loans, increased 59% from 2009. The increase in accruing restructured loans is
due to us taking proactive steps to modify loans in order to mitigate losses related to borrowers experiencing financial
difficulty. As a result of the modifications, the current portfolio exhibits strong payment performance with 86% current on
principal and interest payments at December 31, 2010. Total growth in this portfolio has slowed during the latter half of 2010
as a result of a reduced inflow of newly delinquent loans and fewer modifications of more seriously delinquent loans. A key
leading indicator of asset quality, particularly for consumer loans, is early stage delinquencies. This leading indicator of
future asset quality has fallen significantly since the beginning of 2009. During this time, the economy and employment
conditions have improved somewhat, but remain sluggish overall. As a result, we do not expect further improvement in early
stage delinquencies until economic conditions improve. See additional discussion of credit and asset quality in the “Loans,”
“Allowance for Credit Losses,” and “Nonperforming Assets,” sections of this MD&A.
Our capital remained strong during 2010, as evidenced by the increases in our capital ratios. Our Tier 1 capital ratio was
13.67%, which was an increase from 12.96% at December 31, 2009. Our Tier 1 common equity ratio increased to 8.08%
compared to 7.67% at December 31, 2009. Our total capital ratio was stable at 16.54% compared to 16.43% at December 31,
2009. With strong capital, more clarity on capital standards, lower risk, ample liquidity, and improved earnings, we believe
that we are well-positioned to repay TARP at the appropriate time and in a fashion that makes the most sense from both
shareholder and regulatory perspectives. We have been and will continue to invest in our people and businesses to support
future growth. At the same time, we recognize the value of returning capital to shareholders, so in that regard, our priorities
are repaying TARP and increasing the common dividend. See additional discussion of our liquidity and capital position in the
“Liquidity Risk” and “Capital Resources” sections of this MD&A.
25