SunTrust 2010 Annual Report Download - page 182
Download and view the complete annual report
Please find page 182 of the 2010 SunTrust annual report below. You can navigate through the pages in the report by either clicking on the pages listed below, or by using the keyword search tool below to find specific information within the annual report.-
 1
1 -
2
-
3
-
4
-
5
-
6
-
7
-
8
-
9
-
10
-
11
-
12
-
13
-
14
-
15
-
16
-
17
-
18
-
19
-
20
-
21
-
22
-
23
-
24
-
25
-
26
-
27
-
28
-
29
-
30
-
31
-
32
-
33
-
34
-
35
-
36
-
37
-
38
-
39
-
40
-
41
-
42
-
43
-
44
-
45
-
46
-
47
-
48
-
49
-
50
-
51
-
52
-
53
-
54
-
55
-
56
-
57
-
58
-
59
-
60
-
61
-
62
-
63
-
64
-
65
-
66
-
67
-
68
-
69
-
70
-
71
-
72
-
73
-
74
-
75
-
76
-
77
-
78
-
79
-
80
-
81
-
82
-
83
-
84
-
85
-
86
-
87
-
88
-
89
-
90
-
91
-
92
-
93
-
94
-
95
-
96
-
97
-
98
-
99
-
100
-
101
-
102
-
103
-
104
-
105
-
106
-
107
-
108
-
109
-
110
-
111
-
112
-
113
-
114
-
115
-
116
-
117
-
118
-
119
-
120
-
121
-
122
-
123
-
124
-
125
-
126
-
127
-
128
-
129
-
130
-
131
-
132
-
133
-
134
-
135
-
136
-
137
-
138
-
139
-
140
-
141
-
142
-
143
-
144
-
145
-
146
-
147
-
148
-
149
-
150
-
151
-
152
-
153
-
154
-
155
-
156
-
157
-
158
-
159
-
160
-
161
-
162
-
163
-
164
-
165
-
166
-
167
-
168
-
169
-
170
-
171
-
 172
172 -
 173
173 -
 174
174 -
 175
175 -
 176
176 -
 177
177 -
 178
178 -
 179
179 -
 180
180 -
 181
181 -
 182
182 -
 183
183 -
 184
184 -
 185
185 -
 186
186 -
 187
187 -
 188
188 -
 189
189 -
 190
190 -
 191
191 -
 192
192 -
193
-
194
-
195
-
196
-
197
-
198
-
199
-
200
-
201
-
202
-
203
-
204
-
205
-
206
-
207
-
208
-
209
-
210
-
211
-
212
-
213
-
214
-
215
-
216
-
217
-
218
-
219
-
220
 |
 |

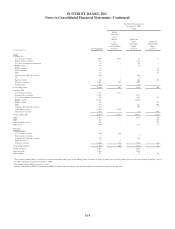
SUNTRUST BANKS, INC.
Notes to Consolidated Financial Statements (Continued)
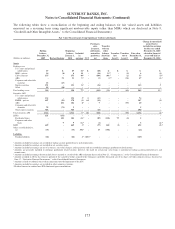
Fair Value Gain/(Loss) for the Year Ended
December 31, 2009, for Items Measured at Fair Value Pursuant
to Election of the FVO
(Dollars in millions)
Trading Account
Profits/(Losses) and
Commissions
Mortgage
Production Related
Income2
Mortgage Servicing
Related Income
Total
Changes in Fair Values
Included in Current
Period Earnings1
Assets
Trading assets $3 $- $- $3
LHFS 2 625 - 627
LHFI 3 (1) - 2
Other intangible assets - 17 66 83
Liabilities
Brokered deposits 11 - - 11
Long-term debt (65) - - (65)
1Changes in fair value for the year ended December 31, 2009, exclude accrued interest for the periods then ended. Interest income or interest expense
on trading assets, LHFI, LHFS, brokered deposits and long-term debt that have been elected to be carried at fair value are recorded in interest income
or interest expense in the Consolidated Statements of Income/(Loss) based on their contractual coupons. Certain trading assets do not have a
contractually stated coupon and, for these securities, the Company records interest income based on the effective yield calculated upon acquisitionof
the securities.
2For the year ended December 31, 2009, income related to LHFS includes $664 million related to MSRs recognized upon the sale of loans reported at
fair value. For the year ended December 31, 2009, income related to other intangible assets includes $18 million of MSRs recognized upon the sale of
loans reported at LOCOM. These MSRs are included in the table since the Company elected to report MSRs recognized in 2009 using the fair value
method. Previously, MSRs were reported under the amortized cost method.
The following is a discussion of the valuation techniques and inputs used in developing fair value measurements for assets
and liabilities classified as level 2 or level 3 that are measured at fair value on a recurring basis, based on the class of
financial instrument as determined by the nature and risks of the instrument.
Trading Assets and Securities Available for Sale
Federal agency securities
The Company includes in this classification securities issued by federal agencies and GSEs. Agency securities consist
of debt obligations issued by HUD, FHLB, and other agencies, or collateralized by loans that are guaranteed by the
SBA and are, therefore, backed by the full faith and credit of the U.S. government. In the case of securities issued by
GSEs such as Fannie Mae and Freddie Mac, the obligations are not explicitly guaranteed by the U.S. government;
however, the GSEs carry an implied AAA rating and may be required to maintain such rating through its agency
agreement. In certain instances, the U.S. Treasury owns the senior preferred stock of these enterprises and has made a
commitment under that stock purchase agreement to provide these GSEs with funds to maintain a positive net worth.
The majority of Federal agency securities are valued by an independent pricing service that is widely used by market
participants. The Company has determined that this pricing service is using similar instruments that are trading in the
markets as the basis for its estimates of fair value and, as such, the Company appropriately classifies these instruments
as level 2. For SBA instruments, the Company estimates fair value based on pricing from observable trading activity for
similar securities or obtains fair values from a third party pricing service; accordingly, the Company has also classified
these instruments as level 2. These SBA instruments were transferred out of level 3 during the second quarter of 2009.
The Company began to observe marginal increases in the volume and level of observable trading activity during the
first quarter of 2009 and significant increases in such activity during the second quarter of 2009. This level of activity
provided the Company with sufficient market evidence of pricing, such that the Company did not have to make any
significant adjustments to observed pricing, nor was the Company’s pricing based on unobservable data.
U.S. states and political subdivisions
The Company’s investments in U.S. states and political subdivisions (collectively “municipals”) include obligations
of county and municipal authorities and agency bonds, which are general obligations of the municipality or are
supported by a specified revenue source. The majority of these obligations are priced by an independent pricing
service using pricing observed on trades of similar bonds and, therefore, are classified as level 2 in the fair value
hierarchy. Holdings are geographically dispersed, with no significant concentrations in any one state or municipality.
Additionally, 99% of AFS municipal obligations classified as level 2 are rated AAA or AA, or are otherwise
collateralized by securities backed by the full faith and credit of the federal government.
166