SunTrust 2010 Annual Report Download - page 192
Download and view the complete annual report
Please find page 192 of the 2010 SunTrust annual report below. You can navigate through the pages in the report by either clicking on the pages listed below, or by using the keyword search tool below to find specific information within the annual report.-
 1
1 -
2
-
3
-
4
-
5
-
6
-
7
-
8
-
9
-
10
-
11
-
12
-
13
-
14
-
15
-
16
-
17
-
18
-
19
-
20
-
21
-
22
-
23
-
24
-
25
-
26
-
27
-
28
-
29
-
30
-
31
-
32
-
33
-
34
-
35
-
36
-
37
-
38
-
39
-
40
-
41
-
42
-
43
-
44
-
45
-
46
-
47
-
48
-
49
-
50
-
51
-
52
-
53
-
54
-
55
-
56
-
57
-
58
-
59
-
60
-
61
-
62
-
63
-
64
-
65
-
66
-
67
-
68
-
69
-
70
-
71
-
72
-
73
-
74
-
75
-
76
-
77
-
78
-
79
-
80
-
81
-
82
-
83
-
84
-
85
-
86
-
87
-
88
-
89
-
90
-
91
-
92
-
93
-
94
-
95
-
96
-
97
-
98
-
99
-
100
-
101
-
102
-
103
-
104
-
105
-
106
-
107
-
108
-
109
-
110
-
111
-
112
-
113
-
114
-
115
-
116
-
117
-
118
-
119
-
120
-
121
-
122
-
123
-
124
-
125
-
126
-
127
-
128
-
129
-
130
-
131
-
132
-
133
-
134
-
135
-
136
-
137
-
138
-
139
-
140
-
141
-
142
-
143
-
144
-
145
-
146
-
147
-
148
-
149
-
150
-
151
-
152
-
153
-
154
-
155
-
156
-
157
-
158
-
159
-
160
-
161
-
162
-
163
-
164
-
165
-
166
-
167
-
168
-
169
-
170
-
171
-
172
-
173
-
174
-
175
-
176
-
177
-
178
-
179
-
180
-
181
-
 182
182 -
 183
183 -
 184
184 -
 185
185 -
 186
186 -
 187
187 -
 188
188 -
 189
189 -
 190
190 -
 191
191 -
 192
192 -
 193
193 -
 194
194 -
 195
195 -
 196
196 -
 197
197 -
 198
198 -
 199
199 -
 200
200 -
 201
201 -
 202
202 -
203
-
204
-
205
-
206
-
207
-
208
-
209
-
210
-
211
-
212
-
213
-
214
-
215
-
216
-
217
-
218
-
219
-
220
 |
 |

SUNTRUST BANKS, INC.
Notes to Consolidated Financial Statements (Continued)
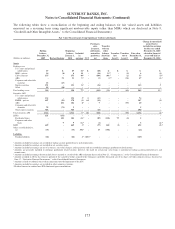
Fair Value Measurements
Using Significant Unobservable Inputs
(Dollars in millions)
Beginning
balance
January 1,
2009
Included in
earnings
Other
comprehensive
income
Purchases,
sales,
issuances,
settlements,
maturities
paydowns, net
Transfers to/
from other
balance
sheet
line items
Level 3
transfers, net
Fair value
December 31,
2009
Change in
unrealized
gains/
(losses)
included in
earnings for
the year
ended
December 31,
2009 related
to financial
instruments
still held at
December 31,
2009
Assets
Trading assets
U.S. Treasury and federal agencies $645 ($3) $- ($181) $- ($461) $- $-
U.S. states and political subdivisions 7 - - - - - 7 -
RMBS – private 38 1 - (25) - - 14 (7)
CDO 262 (4) 5- (83) - - 175 -
Corporate debt securities 7 3 - (10) - - - -
CP - - - 1,295 - (1,295) - -
Other debt securities 23 1 - 1 - - 25 1
Equity securities 102 6 5- 43 - - 151 2
Derivative contracts 249 1 (250) - - - - -
Other 58 (11) - (4) - (25) 18 9
Total trading assets 1,391 (6) 1, 5 (250) 61,036 - (1,781) 390 5 1
Securities AFS
U.S. states and political subdivisions 79 5 5(3) 48 - 3 132 -
RMBS – private 522 (21) 29 (123) - - 407 (19)
Other debt securities 28 - 3 47 - - 78 -
Other equity securities 860 - (4) (151) - - 705 -
Total securities AFS 1,489 (16) 2, 5 25 (179) - 3 1,322 (19) 2
LHFS 487 (9) 3- (82) (279) 34 151 (19) 3
LHFI 270 2 4- (72) 263 (14) 449 15 4
Other assets/(liabilities), net 72 630 3- (40) (697) - (35) 6
Liabilities
Trading liabilities - - (46) 6- - - (46) -
Long-term debt (3,496) 130 1- - - 3,366 - -
1Amounts included in earnings are recorded in trading account profits/(losses) and commissions.
2Amounts included in earnings are recorded in net securities gains/(losses).
3Amounts included in earnings are net of issuances, fair value changes, and expirations and are recorded in mortgage production related income.
4Amounts are generally included in mortgage production related income except $2.4 million for the year ended December 31, 2009 related to loans acquired in the GB&T acquisition.
The mark on these loans is included in trading account profits/(losses) and commissions.
5Amounts included in earnings do not include losses accrued as a result of the ARS settlement discussed in Note 21, “Contingencies,” to the Consolidated Financial Statements.
6Amount recorded in OCI is the effective portion of the cash flow hedges related to the Company’s probable forecasted sale of its shares of Coke stock as discussed in Note 17, “Derivative Financial
Instruments,” to the Consolidated Financial Statements.
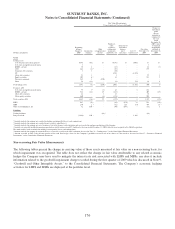
Non-recurring Fair Value Measurements
The following tables present the change in carrying value of those assets measured at fair value on a non-recurring basis, for
which impairment was recognized. The table does not reflect the change in fair value attributable to any related economic
hedges the Company may have used to mitigate the interest rate risk associated with LHFS and MSRs, nor does it include
information related to the goodwill impairment charge recorded during the first quarter of 2009 which is discussed in Note 9,
“Goodwill and Other Intangible Assets,” to the Consolidated Financial Statements. The Company’s economic hedging
activities for LHFS and MSRs are deployed at the portfolio level.
176