SunTrust 2010 Annual Report Download - page 130
Download and view the complete annual report
Please find page 130 of the 2010 SunTrust annual report below. You can navigate through the pages in the report by either clicking on the pages listed below, or by using the keyword search tool below to find specific information within the annual report.-
 1
1 -
 2
2 -
 3
3 -
 4
4 -
 5
5 -
 6
6 -
 7
7 -
 8
8 -
 9
9 -
 10
10 -
 11
11 -
 12
12 -
 13
13 -
 14
14 -
 15
15 -
 16
16 -
 17
17 -
 18
18 -
 19
19 -
 20
20 -
 21
21 -
 22
22 -
 23
23 -
 24
24 -
 25
25 -
 26
26 -
 27
27 -
 28
28 -
 29
29 -
 30
30 -
 31
31 -
 32
32 -
 33
33 -
 34
34 -
 35
35 -
 36
36 -
 37
37 -
 38
38 -
 39
39 -
 40
40 -
 41
41 -
 42
42 -
 43
43 -
 44
44 -
 45
45 -
 46
46 -
 47
47 -
 48
48 -
 49
49 -
 50
50 -
 51
51 -
 52
52 -
 53
53 -
 54
54 -
 55
55 -
 56
56 -
 57
57 -
 58
58 -
 59
59 -
 60
60 -
 61
61 -
 62
62 -
 63
63 -
 64
64 -
 65
65 -
 66
66 -
 67
67 -
 68
68 -
 69
69 -
 70
70 -
 71
71 -
 72
72 -
 73
73 -
 74
74 -
 75
75 -
 76
76 -
 77
77 -
 78
78 -
 79
79 -
 80
80 -
 81
81 -
 82
82 -
 83
83 -
 84
84 -
 85
85 -
 86
86 -
 87
87 -
 88
88 -
 89
89 -
 90
90 -
 91
91 -
 92
92 -
 93
93 -
 94
94 -
 95
95 -
 96
96 -
 97
97 -
 98
98 -
 99
99 -
 100
100 -
 101
101 -
 102
102 -
 103
103 -
 104
104 -
 105
105 -
 106
106 -
 107
107 -
 108
108 -
 109
109 -
 110
110 -
 111
111 -
 112
112 -
 113
113 -
 114
114 -
 115
115 -
 116
116 -
 117
117 -
 118
118 -
 119
119 -
 120
120 -
 121
121 -
 122
122 -
 123
123 -
 124
124 -
 125
125 -
 126
126 -
 127
127 -
 128
128 -
 129
129 -
 130
130 -
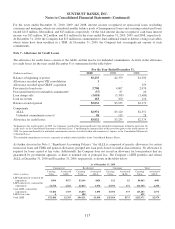 131
131 -
 132
132 -
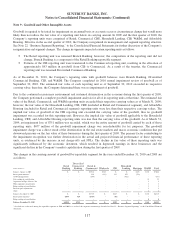 133
133 -
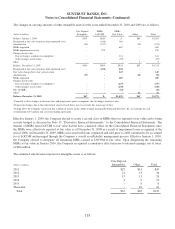 134
134 -
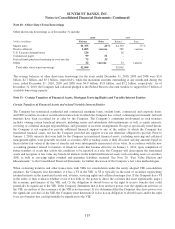 135
135 -
 136
136 -
 137
137 -
 138
138 -
 139
139 -
 140
140 -
 141
141 -
 142
142 -
 143
143 -
 144
144 -
 145
145 -
 146
146 -
 147
147 -
 148
148 -
 149
149 -
 150
150 -
 151
151 -
 152
152 -
 153
153 -
 154
154 -
 155
155 -
 156
156 -
 157
157 -
 158
158 -
 159
159 -
 160
160 -
 161
161 -
 162
162 -
 163
163 -
 164
164 -
 165
165 -
 166
166 -
 167
167 -
 168
168 -
 169
169 -
 170
170 -
 171
171 -
 172
172 -
 173
173 -
 174
174 -
 175
175 -
 176
176 -
 177
177 -
 178
178 -
 179
179 -
 180
180 -
 181
181 -
 182
182 -
 183
183 -
 184
184 -
 185
185 -
 186
186 -
 187
187 -
 188
188 -
 189
189 -
 190
190 -
 191
191 -
 192
192 -
 193
193 -
 194
194 -
 195
195 -
 196
196 -
 197
197 -
 198
198 -
 199
199 -
 200
200 -
 201
201 -
 202
202 -
 203
203 -
 204
204 -
 205
205 -
 206
206 -
 207
207 -
 208
208 -
 209
209 -
 210
210 -
 211
211 -
 212
212 -
 213
213 -
 214
214 -
 215
215 -
 216
216 -
 217
217 -
 218
218 -
 219
219 -
 220
220
 |
 |

SUNTRUST BANKS, INC.
Notes to Consolidated Financial Statements (Continued)
As of December 31, 2009
(Dollars in millions)
Unpaid
Principal
Balance
Amortized
Cost1
Related
Allowance
Impaired loans with no related allowance recorded:
Commercial loans:
Commercial & industrial $170 $153 $-
Commercial real estate 36 32 -
Commercial construction 92 82 -
Total commercial loans 298 267 -
Impaired loans with an allowance recorded:
Commercial loans:
Commercial & industrial 214 191 56
Commercial real estate 74 67 11
Commercial construction 860 770 127
Total commercial loans 1,148 1,028 194
Residential loans:
Residential mortgages - nonguaranteed 2,075 1,991 272
Home equity products 287 287 48
Residential construction 180 174 23
Total residential loans 2,542 2,452 343
Consumer loans:
Other direct 6 6 1
Total impaired loans $3,994 $3,753 $538
1Amortized cost reflects charge-offs that have been recognized plus other amounts that have been applied to
reduce net book balance.
The tables above exclude student loans and residential mortgages that were guaranteed by government agencies and for
which there was nominal risk of principal loss.
The average recorded investment in loans individually evaluated for impairment and restructured loans for the years ended
December 31, 2010, 2009, and 2008 was $4.1 billion, $3.0 billion, and $1.0 billion, respectively.
Nonperforming assets at December 31, 2010 and 2009 are shown in the following table:
(Dollars in millions)
December 31,
2010
December 31,
2009
Nonperforming Assets
Nonaccrual/NPLs:
Commercial loans:
Commercial & industrial1$584 $732
Commercial real estate 342 191
Commercial construction 961 1,247
Residential loans:
Residential mortgages - nonguaranteed21,543 2,283
Home equity products 355 367
Residential construction 290 529
Consumer loans:
Other direct 10 8
Indirect 25 45
Total nonaccrual/NPLs 4,110 5,402
OREO3596 620
Other repossessed assets 52 79
Total nonperforming assets $4,758 $6,101
1Includes $4 million and $12 million of loans carried at fair value at December 31, 2010 and 2009, respectively.
2Includes $24 million and $34 million of loans carried at fair value at December 31, 2010 and 2009, respectively.
3Does not include foreclosed real estate related to serviced loans insured by the FHA or the VA. Insurance
proceeds due from the FHA and the VA are recorded as a receivable in other assets until the funds are received
and the property is conveyed.
114
