SunTrust 2010 Annual Report Download - page 158
Download and view the complete annual report
Please find page 158 of the 2010 SunTrust annual report below. You can navigate through the pages in the report by either clicking on the pages listed below, or by using the keyword search tool below to find specific information within the annual report.-
 1
1 -
2
-
3
-
4
-
5
-
6
-
7
-
8
-
9
-
10
-
11
-
12
-
13
-
14
-
15
-
16
-
17
-
18
-
19
-
20
-
21
-
22
-
23
-
24
-
25
-
26
-
27
-
28
-
29
-
30
-
31
-
32
-
33
-
34
-
35
-
36
-
37
-
38
-
39
-
40
-
41
-
42
-
43
-
44
-
45
-
46
-
47
-
48
-
49
-
50
-
51
-
52
-
53
-
54
-
55
-
56
-
57
-
58
-
59
-
60
-
61
-
62
-
63
-
64
-
65
-
66
-
67
-
68
-
69
-
70
-
71
-
72
-
73
-
74
-
75
-
76
-
77
-
78
-
79
-
80
-
81
-
82
-
83
-
84
-
85
-
86
-
87
-
88
-
89
-
90
-
91
-
92
-
93
-
94
-
95
-
96
-
97
-
98
-
99
-
100
-
101
-
102
-
103
-
104
-
105
-
106
-
107
-
108
-
109
-
110
-
111
-
112
-
113
-
114
-
115
-
116
-
117
-
118
-
119
-
120
-
121
-
122
-
123
-
124
-
125
-
126
-
127
-
128
-
129
-
130
-
131
-
132
-
133
-
134
-
135
-
136
-
137
-
138
-
139
-
140
-
141
-
142
-
143
-
144
-
145
-
146
-
147
-
 148
148 -
 149
149 -
 150
150 -
 151
151 -
 152
152 -
 153
153 -
 154
154 -
 155
155 -
 156
156 -
 157
157 -
 158
158 -
 159
159 -
 160
160 -
 161
161 -
 162
162 -
 163
163 -
 164
164 -
 165
165 -
 166
166 -
 167
167 -
 168
168 -
169
-
170
-
171
-
172
-
173
-
174
-
175
-
176
-
177
-
178
-
179
-
180
-
181
-
182
-
183
-
184
-
185
-
186
-
187
-
188
-
189
-
190
-
191
-
192
-
193
-
194
-
195
-
196
-
197
-
198
-
199
-
200
-
201
-
202
-
203
-
204
-
205
-
206
-
207
-
208
-
209
-
210
-
211
-
212
-
213
-
214
-
215
-
216
-
217
-
218
-
219
-
220
 |
 |

SUNTRUST BANKS, INC.
Notes to Consolidated Financial Statements (Continued)
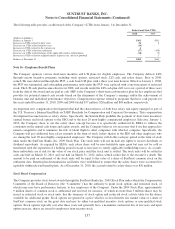
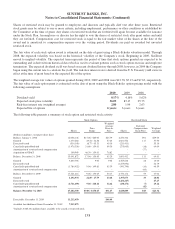
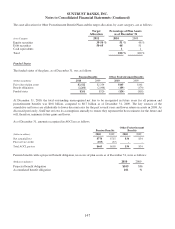
The change in benefit obligations for the years ended December 31 was as follows:
Pension Benefits
Other Postretirement
Benefits
(Dollars in millions) 2010 2009 2010 2009
Benefit obligation, beginning of year $2,008 $1,922 $179 $205
Service cost 69 64 --
Interest cost 129 119 10 11
Plan participants’ contributions --20 22
Actuarial (gain)/loss 209 19 7(28)
Benefits paid (95) (116) (30) (34)
Less federal Medicare drug subsidy --33
Plan amendments (59) ---
Benefit obligation, end of year $2,261 $2,008 $189 $179
The accumulated benefit obligation for the Pension Benefits at December 31, 2010 and 2009 was $2.2 billion and $1.9
billion, respectively.
Pension Benefits
Other Post-
retirement Benefits
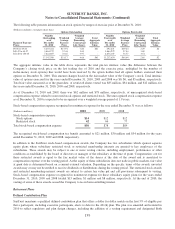
(Weighted average assumptions used to
determine benefit obligations, end of year) 2010 2009 2010 2009
Discount rate 5.67 % 6.32 % 5.10 % 5.70 %
Rate of compensation increase 4.00 24.00 1N/A N/A
1At year-end 2009, all salaries were expected to increase by 2% for 2010, 3% for 2011, 3.5% for 2012, and 4% for 2013 and beyond.
2At year-end 2010, all base salaries were expected to increase by 3% for 2011, 3.5% for 2012, and 4% for 2013 and beyond. Total pay
is expected to increase by 6% for 2011, 6% for 2012 and 4% for 2013 and beyond.
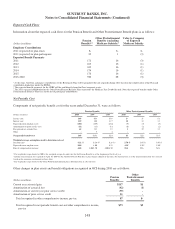
The change in plan assets for the years ended December 31 was as follows:
Pension Benefits Other Postretirement Benefits
(Dollars in millions) 2010 2009 2010 2009
Fair value of plan assets, beginning of
year $2,334 $1,919 $161 $147
Actual return on plan assets 276 506 13 25
Employer contributions 725 11
Plan participants’ contributions --20 22
Benefits paid (95) (116) (30) (34)
Fair value of plan assets, end of year $2,522 $2,334 $165 $161
Employer contributions indicated under pension benefits represent the benefits that were paid to nonqualified plan
participants. SERPs are not funded through plan assets.
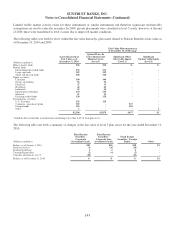
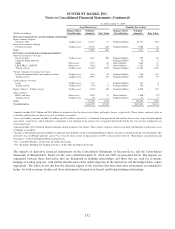
The fair value of plan assets is measured based on the fair value hierarchy which is discussed in detail in Note 20, “Fair Value
Election and Measurement”, to the Consolidated Financial Statements. The valuations are based on third party data received as
of the balance sheet date. Level 1 assets such as equity securities, mutual funds, and REITs are instruments that are traded in
active markets and are valued based on identical instruments. Fixed income securities and common and collective trust funds are
classified as level 2 assets because there is not an identical asset in the market upon which to base the valuation; however, there
are no significant unobservable assumptions used to value level 2 instruments. The common and collective funds are valued
each business day at its reported net asset value, as determined by the issuer, based on the underlying assets of the fund.
Corporate and foreign bonds are valued based on quoted market prices obtained from external pricing sources where trading in
an active market exists for level 2 assets. Level 3 assets primarily consist of private placement and noninvestment grade bonds.
142