SunTrust 2010 Annual Report Download - page 126
Download and view the complete annual report
Please find page 126 of the 2010 SunTrust annual report below. You can navigate through the pages in the report by either clicking on the pages listed below, or by using the keyword search tool below to find specific information within the annual report.-
 1
1 -
2
-
3
-
4
-
5
-
6
-
7
-
8
-
9
-
10
-
11
-
12
-
13
-
14
-
15
-
16
-
17
-
18
-
19
-
20
-
21
-
22
-
23
-
24
-
25
-
26
-
27
-
28
-
29
-
30
-
31
-
32
-
33
-
34
-
35
-
36
-
37
-
38
-
39
-
40
-
41
-
42
-
43
-
44
-
45
-
46
-
47
-
48
-
49
-
50
-
51
-
52
-
53
-
54
-
55
-
56
-
57
-
58
-
59
-
60
-
61
-
62
-
63
-
64
-
65
-
66
-
67
-
68
-
69
-
70
-
71
-
72
-
73
-
74
-
75
-
76
-
77
-
78
-
79
-
80
-
81
-
82
-
83
-
84
-
85
-
86
-
87
-
88
-
89
-
90
-
91
-
92
-
93
-
94
-
95
-
96
-
97
-
98
-
99
-
100
-
101
-
102
-
103
-
104
-
105
-
106
-
107
-
108
-
109
-
110
-
111
-
112
-
113
-
114
-
115
-
 116
116 -
 117
117 -
 118
118 -
 119
119 -
 120
120 -
 121
121 -
 122
122 -
 123
123 -
 124
124 -
 125
125 -
 126
126 -
 127
127 -
 128
128 -
 129
129 -
 130
130 -
 131
131 -
 132
132 -
 133
133 -
 134
134 -
 135
135 -
 136
136 -
137
-
138
-
139
-
140
-
141
-
142
-
143
-
144
-
145
-
146
-
147
-
148
-
149
-
150
-
151
-
152
-
153
-
154
-
155
-
156
-
157
-
158
-
159
-
160
-
161
-
162
-
163
-
164
-
165
-
166
-
167
-
168
-
169
-
170
-
171
-
172
-
173
-
174
-
175
-
176
-
177
-
178
-
179
-
180
-
181
-
182
-
183
-
184
-
185
-
186
-
187
-
188
-
189
-
190
-
191
-
192
-
193
-
194
-
195
-
196
-
197
-
198
-
199
-
200
-
201
-
202
-
203
-
204
-
205
-
206
-
207
-
208
-
209
-
210
-
211
-
212
-
213
-
214
-
215
-
216
-
217
-
218
-
219
-
220
 |
 |

SUNTRUST BANKS, INC.
Notes to Consolidated Financial Statements (Continued)
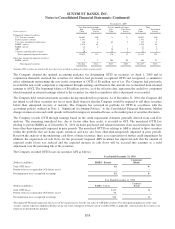
ultimate recoverability of the par value. The Company evaluated its holdings in FHLB stock at December 31, 2010 and
believes its holdings in the stock are ultimately recoverable at par. In addition, the Company does not have operational or
liquidity needs that would require a redemption of the stock in the foreseeable future and therefore determined that the stock
was not other-than-temporarily impaired.
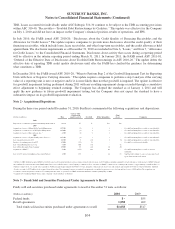
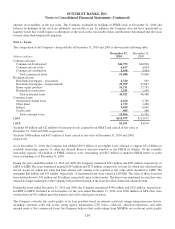
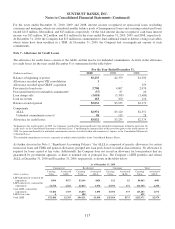
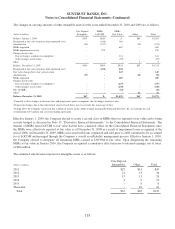
Note 6 - Loans
The composition of the Company’s loan portfolio at December 31, 2010 and 2009 is shown in the following table:
(Dollars in millions)
December 31,
2010
December 31,
2009
Commercial loans:
Commercial & industrial1$44,753 $44,008
Commercial real estate 6,167 6,694
Commercial construction 2,568 4,984
Total commercial loans 53,488 55,686
Residential loans:
Residential mortgages - guaranteed 4,520 949
Residential mortgages - nonguaranteed223,959 25,847
Home equity products 16,751 17,783
Residential construction 1,291 1,909
Total residential loans 46,521 46,488
Consumer loans:
Guaranteed student loans 4,260 2,786
Other direct 1,722 1,484
Indirect 9,499 6,665
Credit cards 485 566
Total consumer loans 15,966 11,501
LHFI $115,975 $113,675
LHFS $3,501 $4,670
1Includes $4 million and $12 million of loans previously acquired from GB&T and carried at fair value at
December 31, 2010 and 2009, respectively.
2Includes $488 million and $437 million of loans carried at fair value at December 31, 2010 and 2009,
respectively.
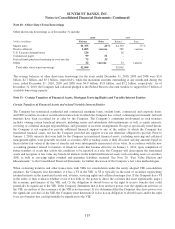
As of December 31, 2010, the Company had pledged $50.2 billion of net eligible loan collateral to support $31.2 billion in
available borrowing capacity at either the Federal Reserve discount window or the FHLB of Atlanta. Of the available
borrowing capacity, $34 million of FHLB advances were outstanding and $6.1 billion of undrawn FHLB letters of credit
were outstanding as of December 31, 2010.
During the years ended December 31, 2010 and 2009, the Company transferred $213 million and $307 million, respectively, in
LHFS to LHFI. The loans transferred included $147 million and $272 million, respectively, in loans for which fair value had been
elected. Loans for which fair value had been elected will continue to be reported at fair value while classified as LHFI. The
remaining $66 million and $35 million, respectively, of transferred loans were valued at LOCOM. The value of these loans had
been written down by $31 million and $9 million, respectively, prior to the transfer. The loans were transferred because they were
deemed no longer marketable or the Company believed that retention of the loans provided a better risk-adjusted return.
During the years ended December 31, 2010 and 2009, the Company transferred $346 million and $125 million, respectively,
in LHFI to LHFS. Included in such transfers for the year ended December 31, 2010 were $160 million of NPLs that were
written down by $51 million upon the transfer and sold to third party investors.
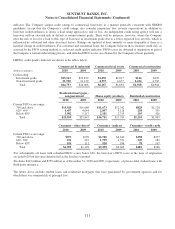
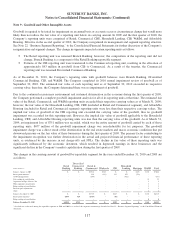
The Company evaluates the credit quality of its loan portfolio based on internal credit risk ratings using numerous factors,
including consumer credit risk scores, rating agency information, LTV ratios, collateral, collection experience, and other
internal metrics. For commercial loans, the Company believes that credit ratings from NRSROs are a relevant credit quality
110