SunTrust 2010 Annual Report Download - page 121
Download and view the complete annual report
Please find page 121 of the 2010 SunTrust annual report below. You can navigate through the pages in the report by either clicking on the pages listed below, or by using the keyword search tool below to find specific information within the annual report.-
 1
1 -
2
-
3
-
4
-
5
-
6
-
7
-
8
-
9
-
10
-
11
-
12
-
13
-
14
-
15
-
16
-
17
-
18
-
19
-
20
-
21
-
22
-
23
-
24
-
25
-
26
-
27
-
28
-
29
-
30
-
31
-
32
-
33
-
34
-
35
-
36
-
37
-
38
-
39
-
40
-
41
-
42
-
43
-
44
-
45
-
46
-
47
-
48
-
49
-
50
-
51
-
52
-
53
-
54
-
55
-
56
-
57
-
58
-
59
-
60
-
61
-
62
-
63
-
64
-
65
-
66
-
67
-
68
-
69
-
70
-
71
-
72
-
73
-
74
-
75
-
76
-
77
-
78
-
79
-
80
-
81
-
82
-
83
-
84
-
85
-
86
-
87
-
88
-
89
-
90
-
91
-
92
-
93
-
94
-
95
-
96
-
97
-
98
-
99
-
100
-
101
-
102
-
103
-
104
-
105
-
106
-
107
-
108
-
109
-
110
-
 111
111 -
 112
112 -
 113
113 -
 114
114 -
 115
115 -
 116
116 -
 117
117 -
 118
118 -
 119
119 -
 120
120 -
 121
121 -
 122
122 -
 123
123 -
 124
124 -
 125
125 -
 126
126 -
 127
127 -
 128
128 -
 129
129 -
 130
130 -
 131
131 -
132
-
133
-
134
-
135
-
136
-
137
-
138
-
139
-
140
-
141
-
142
-
143
-
144
-
145
-
146
-
147
-
148
-
149
-
150
-
151
-
152
-
153
-
154
-
155
-
156
-
157
-
158
-
159
-
160
-
161
-
162
-
163
-
164
-
165
-
166
-
167
-
168
-
169
-
170
-
171
-
172
-
173
-
174
-
175
-
176
-
177
-
178
-
179
-
180
-
181
-
182
-
183
-
184
-
185
-
186
-
187
-
188
-
189
-
190
-
191
-
192
-
193
-
194
-
195
-
196
-
197
-
198
-
199
-
200
-
201
-
202
-
203
-
204
-
205
-
206
-
207
-
208
-
209
-
210
-
211
-
212
-
213
-
214
-
215
-
216
-
217
-
218
-
219
-
220
 |
 |

SUNTRUST BANKS, INC.
Notes to Consolidated Financial Statements (Continued)
Securities purchased under agreements to resell are collateralized by U.S. government or agency securities and are carried at
the amounts at which securities will be subsequently resold. The Company takes possession of all securities under
agreements to resell and performs the appropriate margin evaluation on the acquisition date based on market volatility, as
necessary. The Company requires collateral between 100% and 110% of the underlying securities. The total market value of
the collateral held was $1.1 billion and $464 million at December 31, 2010 and 2009, of which $165 million and $110
million was repledged, respectively.
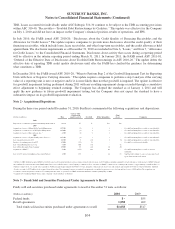
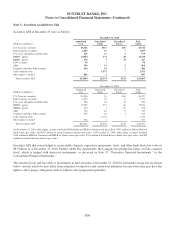
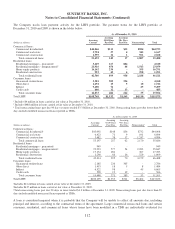
Note 4 - Trading Assets and Liabilities
The fair values of the components of trading assets and liabilities at December 31 were as follows:
As of December 31
(Dollars in millions) 2010 2009
Trading Assets
U.S. Treasury securities $187 $499
Federal agency securities 361 474
U.S. states and political subdivisions 123 59
RMBS - agency 301 94
MBS - private 15 6
CDO securities 55 175
ABS 59 51
Corporate and other debt securities 743 466
CP 14 1
Equity securities 221 256
Derivative contracts 2,743 2,610
Trading loans 1,353 289
Total trading assets $6,175 $4,980
Trading Liabilities
U.S. Treasury securities $439 $190
Federal agency securities -3
Corporate and other debt securities 398 144
Equity securities -8
Derivative contracts 1,841 1,844
Total trading liabilities $2,678 $2,189
See Note 21, “Contingencies,” to the Consolidated Financial Statements for information concerning ARS added to trading
assets in 2008 as well as the current position in those assets at December 31, 2010.
Trading instruments are used as part of the Company’s overall balance sheet management strategies and to support client
requirements through its broker/dealer subsidiary. The Company utilized trading instruments for balance sheet management
purposes and manages the potential market volatility of these instruments with appropriate duration and/or hedging
strategies. The size, volume and nature of the trading instruments can vary based on economic and Company specific asset or
liability conditions. Product offerings to clients include debt securities, loans traded in the secondary market, equity
securities, derivative and foreign exchange contracts, and similar financial instruments. Other trading activities include acting
as a market maker in certain debt and equity securities and related derivatives. The Company has policies and procedures to
manage market risk associated with these client trading activities, and will assume a limited degree of market risk by
managing the size and nature of its exposure. The Company has pledged $823 million of certain trading assets and cash
equivalents to secure $793 million of repurchase agreements as of December 31, 2010.
105