SunTrust 2010 Annual Report Download - page 50
Download and view the complete annual report
Please find page 50 of the 2010 SunTrust annual report below. You can navigate through the pages in the report by either clicking on the pages listed below, or by using the keyword search tool below to find specific information within the annual report.-
 1
1 -
2
-
3
-
4
-
5
-
6
-
7
-
8
-
9
-
10
-
11
-
12
-
13
-
14
-
15
-
16
-
17
-
18
-
19
-
20
-
21
-
22
-
23
-
24
-
25
-
26
-
27
-
28
-
29
-
30
-
31
-
32
-
33
-
34
-
35
-
36
-
37
-
38
-
39
-
 40
40 -
 41
41 -
 42
42 -
 43
43 -
 44
44 -
 45
45 -
 46
46 -
 47
47 -
 48
48 -
 49
49 -
 50
50 -
 51
51 -
 52
52 -
 53
53 -
 54
54 -
 55
55 -
 56
56 -
 57
57 -
 58
58 -
 59
59 -
 60
60 -
61
-
62
-
63
-
64
-
65
-
66
-
67
-
68
-
69
-
70
-
71
-
72
-
73
-
74
-
75
-
76
-
77
-
78
-
79
-
80
-
81
-
82
-
83
-
84
-
85
-
86
-
87
-
88
-
89
-
90
-
91
-
92
-
93
-
94
-
95
-
96
-
97
-
98
-
99
-
100
-
101
-
102
-
103
-
104
-
105
-
106
-
107
-
108
-
109
-
110
-
111
-
112
-
113
-
114
-
115
-
116
-
117
-
118
-
119
-
120
-
121
-
122
-
123
-
124
-
125
-
126
-
127
-
128
-
129
-
130
-
131
-
132
-
133
-
134
-
135
-
136
-
137
-
138
-
139
-
140
-
141
-
142
-
143
-
144
-
145
-
146
-
147
-
148
-
149
-
150
-
151
-
152
-
153
-
154
-
155
-
156
-
157
-
158
-
159
-
160
-
161
-
162
-
163
-
164
-
165
-
166
-
167
-
168
-
169
-
170
-
171
-
172
-
173
-
174
-
175
-
176
-
177
-
178
-
179
-
180
-
181
-
182
-
183
-
184
-
185
-
186
-
187
-
188
-
189
-
190
-
191
-
192
-
193
-
194
-
195
-
196
-
197
-
198
-
199
-
200
-
201
-
202
-
203
-
204
-
205
-
206
-
207
-
208
-
209
-
210
-
211
-
212
-
213
-
214
-
215
-
216
-
217
-
218
-
219
-
220
 |
 |

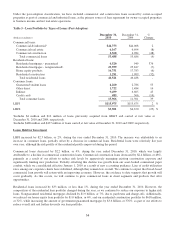
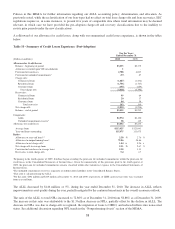
Under the post-adoption classification, we have included commercial and construction loans secured by owner-occupied
properties as part of commercial and industrial loans, as the primary source of loan repayment for owner-occupied properties
is business income and not real estate operations.
Table 5 - Loan Portfolio by Types of Loans (Post-Adoption)
(Dollars in millions)
December 31,
2010
December 31,
2009
%
Change
Commercial loans:
Commercial & industrial1$44,753 $44,008 2
Commercial real estate 6,167 6,694 (8)
Commercial construction 2,568 4,984 (48)
Total commercial loans 53,488 55,686 (4)
Residential loans:
Residential mortgages - guaranteed 4,520 949 376
Residential mortgages - nonguaranteed223,959 25,847 (7)
Home equity products 16,751 17,783 (6)
Residential construction 1,291 1,909 (32)
Total residential loans 46,521 46,488 -
Consumer loans:
Guaranteed student loans 4,260 2,786 53
Other direct 1,722 1,484 16
Indirect 9,499 6,665 43
Credit cards 485 566 (14)
Total consumer loans 15,966 11,501 39
LHFI $115,975 $113,675 2 %
LHFS $3,501 $4,670 (25) %
1Includes $4 million and $12 million of loans previously acquired from GB&T and carried at fair value at
December 31, 2010 and 2009, respectively.
2Includes $488 million and $437 million of loans carried at fair value at December 31, 2010 and 2009, respectively.
Loans Held for Investment
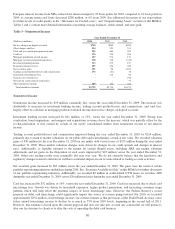
LHFI increased by $2.3 billion, or 2%, during the year ended December 31, 2010. The increase was attributable to an
increase in consumer loans, partially offset by a decrease in commercial loans. Residential loans were relatively flat year
over year, although the risk profile of the residential profile improved during the period.
Commercial loans decreased by $2.2 billion, or 4%, during the year ended December 31, 2010, which was largely
attributable to a decline in commercial construction loans. Commercial construction loans decreased by $2.4 billion, or 48%,
primarily as a result of our efforts to reduce risk levels by aggressively managing existing construction exposure and
significantly limiting new production. Partially offsetting this decline was growth from our asset-backed commercial paper
conduit, which we consolidated effective January 1, 2010 as a result of new accounting guidance. Line of credit utilization
rates among our corporate clients have stabilized, although they remain low overall. We continue to expect that broad-based
commercial loan growth will return with an improving economy. However, the evidence to date suggests that growth will
occur gradually. As this occurs, we will continue to grow commercial loans in client segments and products that offer
opportunities.
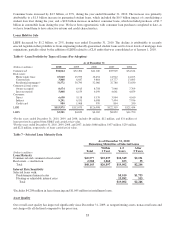
Residential loans increased by $33 million, or less than 1%, during the year ended December 31, 2010. However, the
composition of the residential loan portfolio changed during the year, as we continued to reduce our exposure to higher risk
loans. Nonguaranteed residential mortgages declined by $1.9 billion, or 7%, due to paydowns and charge-offs. Additionally,
we reduced our home equity loan portfolio by $1.0 billion, or 6%, and our residential construction portfolio by $618 million,
or 32%, while increasing the amount of government guaranteed mortgages by $3.6 billion, or 376%, as part of our efforts to
reduce overall risk and further diversify our loan portfolio.
34