SunTrust 2010 Annual Report Download - page 123
Download and view the complete annual report
Please find page 123 of the 2010 SunTrust annual report below. You can navigate through the pages in the report by either clicking on the pages listed below, or by using the keyword search tool below to find specific information within the annual report.-
 1
1 -
2
-
3
-
4
-
5
-
6
-
7
-
8
-
9
-
10
-
11
-
12
-
13
-
14
-
15
-
16
-
17
-
18
-
19
-
20
-
21
-
22
-
23
-
24
-
25
-
26
-
27
-
28
-
29
-
30
-
31
-
32
-
33
-
34
-
35
-
36
-
37
-
38
-
39
-
40
-
41
-
42
-
43
-
44
-
45
-
46
-
47
-
48
-
49
-
50
-
51
-
52
-
53
-
54
-
55
-
56
-
57
-
58
-
59
-
60
-
61
-
62
-
63
-
64
-
65
-
66
-
67
-
68
-
69
-
70
-
71
-
72
-
73
-
74
-
75
-
76
-
77
-
78
-
79
-
80
-
81
-
82
-
83
-
84
-
85
-
86
-
87
-
88
-
89
-
90
-
91
-
92
-
93
-
94
-
95
-
96
-
97
-
98
-
99
-
100
-
101
-
102
-
103
-
104
-
105
-
106
-
107
-
108
-
109
-
110
-
111
-
112
-
 113
113 -
 114
114 -
 115
115 -
 116
116 -
 117
117 -
 118
118 -
 119
119 -
 120
120 -
 121
121 -
 122
122 -
 123
123 -
 124
124 -
 125
125 -
 126
126 -
 127
127 -
 128
128 -
 129
129 -
 130
130 -
 131
131 -
 132
132 -
 133
133 -
134
-
135
-
136
-
137
-
138
-
139
-
140
-
141
-
142
-
143
-
144
-
145
-
146
-
147
-
148
-
149
-
150
-
151
-
152
-
153
-
154
-
155
-
156
-
157
-
158
-
159
-
160
-
161
-
162
-
163
-
164
-
165
-
166
-
167
-
168
-
169
-
170
-
171
-
172
-
173
-
174
-
175
-
176
-
177
-
178
-
179
-
180
-
181
-
182
-
183
-
184
-
185
-
186
-
187
-
188
-
189
-
190
-
191
-
192
-
193
-
194
-
195
-
196
-
197
-
198
-
199
-
200
-
201
-
202
-
203
-
204
-
205
-
206
-
207
-
208
-
209
-
210
-
211
-
212
-
213
-
214
-
215
-
216
-
217
-
218
-
219
-
220
 |
 |

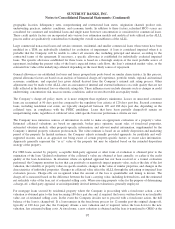
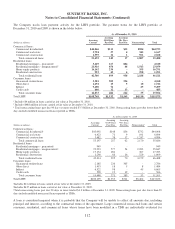
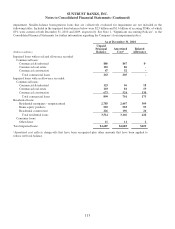
SUNTRUST BANKS, INC.
Notes to Consolidated Financial Statements (Continued)
(Dollars in millions)
1 Year
or Less
1-5
Years
5-10
Years
After 10
Years Total
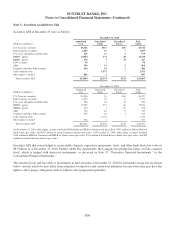
Distribution of Maturities:
Amortized Cost
U.S. Treasury securities $1 $3,390 $2,055 $- $5,446
Federal agency securities 62 1,608 184 29 1,883
U.S. states and political subdivisions 114 290 63 98 565
RMBS - agency 1459 12,738 781 36 14,014
RMBS - private 35 188 155 - 378
CDO securities -50 - -50
ABS 290 504 4 - 798
Corporate and other debt securities 9 307 123 25 464
Total debt securities $970 $19,075 $3,365 $188 $23,598
Fair Value
U.S. Treasury securities $1 $3,505 $2,010 $- $5,516
Federal agency securities 63 1,613 190 29 1,895
U.S. states and political subdivisions 116 303 64 96 579
RMBS - agency 1470 13,039 810 39 14,358
RMBS - private 32 175 140 - 347
CDO securities -50 - -50
ABS 297 508 3 - 808
Corporate and other debt securities 9 314 135 24 482
Total debt securities $988 $19,507 $3,352 $188 $24,035
1Distribution of maturities is based on the expected average life of the assets.
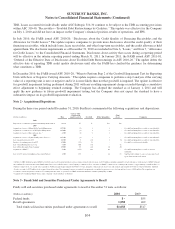
Gross realized gains and losses on sales and OTTI on securities AFS during the periods were as follows:
Year Ended December 31
(Dollars in millions) 2010 2009 2008
Gross realized gains $210 $152 $1,158
Gross realized losses (17) (34) (1)
OTTI (2) (20) (84)
Net securities gains $191 $98 $1,073
Securities in a continuous unrealized loss position at December 31 were as follows:
December 31, 2010
Less than twelve months Twelve months or longer Total
(Dollars in millions)
Fair
Value
Unrealized
Losses
Fair
Value
Unrealized
Losses
Fair
Value
Unrealized
Losses
Temporarily impaired securities
U.S. Treasury securities $2,010 $45 $- $- $2,010 $45
Federal agency securities 1,426 7 - - 1,426 7
U.S. states and political subdivisions 45 1 35 2 80 3
RMBS - agency 3,497 28 - - 3,497 28
RMBS - private 18 - 17 3 35 3
ABS --144144
Corporate and other debt securities - -3131
Total temporarily impaired securities 6,996 81 69 10 7,065 91
Other-than-temporarily impaired securities 1
RMBS - private - - 286 31 286 31
ABS 41 - -41
Total other-than-temporarily impaired securities 4 1 286 31 290 32
Total impaired securities $7,000 $82 $355 $41 $7,355 $123
107