SunTrust 2010 Annual Report Download - page 62
Download and view the complete annual report
Please find page 62 of the 2010 SunTrust annual report below. You can navigate through the pages in the report by either clicking on the pages listed below, or by using the keyword search tool below to find specific information within the annual report.-
 1
1 -
2
-
3
-
4
-
5
-
6
-
7
-
8
-
9
-
10
-
11
-
12
-
13
-
14
-
15
-
16
-
17
-
18
-
19
-
20
-
21
-
22
-
23
-
24
-
25
-
26
-
27
-
28
-
29
-
30
-
31
-
32
-
33
-
34
-
35
-
36
-
37
-
38
-
39
-
40
-
41
-
42
-
43
-
44
-
45
-
46
-
47
-
48
-
49
-
50
-
51
-
 52
52 -
 53
53 -
 54
54 -
 55
55 -
 56
56 -
 57
57 -
 58
58 -
 59
59 -
 60
60 -
 61
61 -
 62
62 -
 63
63 -
 64
64 -
 65
65 -
 66
66 -
 67
67 -
 68
68 -
 69
69 -
 70
70 -
 71
71 -
 72
72 -
73
-
74
-
75
-
76
-
77
-
78
-
79
-
80
-
81
-
82
-
83
-
84
-
85
-
86
-
87
-
88
-
89
-
90
-
91
-
92
-
93
-
94
-
95
-
96
-
97
-
98
-
99
-
100
-
101
-
102
-
103
-
104
-
105
-
106
-
107
-
108
-
109
-
110
-
111
-
112
-
113
-
114
-
115
-
116
-
117
-
118
-
119
-
120
-
121
-
122
-
123
-
124
-
125
-
126
-
127
-
128
-
129
-
130
-
131
-
132
-
133
-
134
-
135
-
136
-
137
-
138
-
139
-
140
-
141
-
142
-
143
-
144
-
145
-
146
-
147
-
148
-
149
-
150
-
151
-
152
-
153
-
154
-
155
-
156
-
157
-
158
-
159
-
160
-
161
-
162
-
163
-
164
-
165
-
166
-
167
-
168
-
169
-
170
-
171
-
172
-
173
-
174
-
175
-
176
-
177
-
178
-
179
-
180
-
181
-
182
-
183
-
184
-
185
-
186
-
187
-
188
-
189
-
190
-
191
-
192
-
193
-
194
-
195
-
196
-
197
-
198
-
199
-
200
-
201
-
202
-
203
-
204
-
205
-
206
-
207
-
208
-
209
-
210
-
211
-
212
-
213
-
214
-
215
-
216
-
217
-
218
-
219
-
220
 |
 |

from financial assets and financial liabilities being carried at different bases of accounting and/or (iii) to more accurately
portray the active and dynamic management of a company’s balance sheet. Based on our balance sheet management
strategies and objectives, we have elected to carry certain financial assets and financial liabilities at fair value; these
instruments include all, or a portion, of the following: long-term debt, LHFS, brokered deposits, MSRs, trading assets, and a
small portion of LHFI.
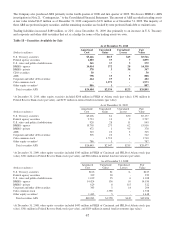
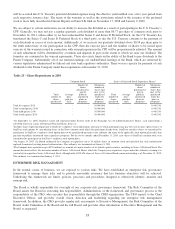
The following is a discussion of the more significant financial assets and financial liabilities that are currently carried at fair
value on the Consolidated Balance Sheets at December 31, 2010 and December 31, 2009. For a complete discussion of our
fair value elections and the methodologies used to estimate the fair values of our financial instruments, refer to Note 20, “Fair
Value Election and Measurement,” to the Consolidated Financial Statements.
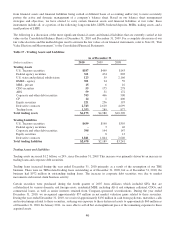
Table 17 - Trading Assets and Liabilities
As of December 31
(Dollars in millions) 2010 2009 2008
Trading Assets
U.S. Treasury securities $187 $499 $143
Federal agency securities 361 474 803
U.S. states and political subdivisions 123 59 2,166
RMBS - agency 301 94 59
MBS - private 15 616
CDO securities 55 175 278
ABS 59 51 172
Corporate and other debt securities 743 466 590
CP 14 1 400
Equity securities 221 256 193
Derivative contracts 2,743 2,610 4,699
Trading loans 1,353 289 877
Total trading assets $6,175 $4,980 $10,396
Trading Liabilities
U.S. Treasury securities $439 $190 $395
Federal agency securities -346
Corporate and other debt securities 398 144 147
Equity securities -813
Derivative contracts 1,841 1,844 2,640
Total trading liabilities $2,678 $2,189 $3,241
Trading Assets and Liabilities
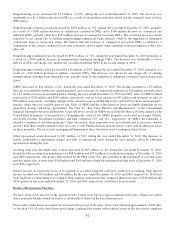
Trading assets increased $1.2 billion, or 24%, since December 31, 2009. This increase was primarily driven by an increase in
trading loans and corporate debt securities.
Trading loans increased during the year ended December 31, 2010 primarily as a result of the resumption of our TRS
business. There were no TRS-related trading loans outstanding as of December 31, 2009, but as of December 31, 2010, the
business had $972 million in outstanding trading loans. The increase in corporate debt securities was due to market
movements and normal client business activity.
Certain securities were purchased during the fourth quarter of 2007 from affiliates which included SIVs that are
collateralized by various domestic and foreign assets, residential MBS, including Alt-A and subprime collateral, CDOs, and
commercial loans, as well as senior interests retained from Company-sponsored securitizations. During the year ended
December 31, 2010, we recognized approximately $37 million in net market valuation gains related to these securities.
During the year ended December 31, 2010, we received approximately $136 million in cash from paydowns, maturities, calls
and restructurings related to these securities, reducing our exposure to these distressed assets to approximately $60 million as
of December 31, 2010. In January 2011, we were able to sell all but an insignificant piece of the remaining exposure to these
acquired assets.
46