SunTrust 2010 Annual Report Download - page 194
Download and view the complete annual report
Please find page 194 of the 2010 SunTrust annual report below. You can navigate through the pages in the report by either clicking on the pages listed below, or by using the keyword search tool below to find specific information within the annual report.-
 1
1 -
2
-
3
-
4
-
5
-
6
-
7
-
8
-
9
-
10
-
11
-
12
-
13
-
14
-
15
-
16
-
17
-
18
-
19
-
20
-
21
-
22
-
23
-
24
-
25
-
26
-
27
-
28
-
29
-
30
-
31
-
32
-
33
-
34
-
35
-
36
-
37
-
38
-
39
-
40
-
41
-
42
-
43
-
44
-
45
-
46
-
47
-
48
-
49
-
50
-
51
-
52
-
53
-
54
-
55
-
56
-
57
-
58
-
59
-
60
-
61
-
62
-
63
-
64
-
65
-
66
-
67
-
68
-
69
-
70
-
71
-
72
-
73
-
74
-
75
-
76
-
77
-
78
-
79
-
80
-
81
-
82
-
83
-
84
-
85
-
86
-
87
-
88
-
89
-
90
-
91
-
92
-
93
-
94
-
95
-
96
-
97
-
98
-
99
-
100
-
101
-
102
-
103
-
104
-
105
-
106
-
107
-
108
-
109
-
110
-
111
-
112
-
113
-
114
-
115
-
116
-
117
-
118
-
119
-
120
-
121
-
122
-
123
-
124
-
125
-
126
-
127
-
128
-
129
-
130
-
131
-
132
-
133
-
134
-
135
-
136
-
137
-
138
-
139
-
140
-
141
-
142
-
143
-
144
-
145
-
146
-
147
-
148
-
149
-
150
-
151
-
152
-
153
-
154
-
155
-
156
-
157
-
158
-
159
-
160
-
161
-
162
-
163
-
164
-
165
-
166
-
167
-
168
-
169
-
170
-
171
-
172
-
173
-
174
-
175
-
176
-
177
-
178
-
179
-
180
-
181
-
182
-
183
-
 184
184 -
 185
185 -
 186
186 -
 187
187 -
 188
188 -
 189
189 -
 190
190 -
 191
191 -
 192
192 -
 193
193 -
 194
194 -
 195
195 -
 196
196 -
 197
197 -
 198
198 -
 199
199 -
 200
200 -
 201
201 -
 202
202 -
 203
203 -
 204
204 -
205
-
206
-
207
-
208
-
209
-
210
-
211
-
212
-
213
-
214
-
215
-
216
-
217
-
218
-
219
-
220
 |
 |

SUNTRUST BANKS, INC.
Notes to Consolidated Financial Statements (Continued)
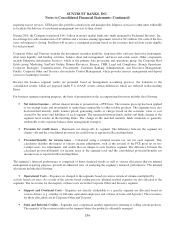
OREO
OREO is measured at the lower of cost or fair value, less costs to sell. Level 2 OREO consists primarily of residential homes,
commercial properties, and vacant lots and land for which current property-specific appraisals, broker pricing opinions, or
other market information is available. Level 3 OREO consists of lots and land for which current property-specific values are
not available. The Company values these properties using a pooled approach.
Affordable Housing
The Company evaluates its consolidated affordable housing partnership investments for impairment whenever events or
changes in circumstances indicate that the carrying amount of the investment may not be recoverable. An impairment is
recorded when the carrying amount of the partnership exceeds its fair value. Fair value measurements for affordable housing
investments are derived from internal models using market assumptions when available. Significant assumptions utilized in
these models include cash flows, market capitalization rates and tax credit market pricing. Due to the lack of comparable
sales in the marketplace, these valuations are considered level 3. During the years ended December 31, 2010 and 2009, the
Company recorded impairment charges of $15 million and $47 million, respectively, on its consolidated affordable housing
partnership investments.
Other Assets
Other assets consist of private equity investments, structured leasing products, other repossessed assets and assets under
operating leases where the Company is the lessor.
Investments in private equity partnerships are valued based on the estimated expected remaining cash flows to be received
from these assets discounted at a market rate that is commensurate with their risk profile. Based on the valuation
methodology and the lack of observable inputs, these investments are considered level 3. During the years ended
December 31, 2010 and 2009, the Company recorded impairment charges attributable to these investments of $5 million and
$22 million, respectively.
Structured leasing consists of assets held for sale under third party operating leases. These assets consist primarily of
commercial buildings and are recorded at fair value less cost to sell. These assets are valued based on internal estimates
which incorporate current market data for similar assets when available. Due to the lack of current market data for
comparable assets, these assets are considered level 3. During the years ended December 31, 2010 and 2009, the Company
recorded impairment charges attributable to these assets of $3 million and $4 million, respectively.
Other repossessed assets consist of repossessed personal property that is measured at fair value less cost to sell. These assets
are considered level 2 as their fair value is determined based on market comparables and broker opinions. During the year
ended December 31, 2010, the Company recorded impairment charges attributable to these assets of $8 million. No
impairment was recorded during 2009.
The Company monitors the fair value of assets under operating leases, where the Company is the lessor, and records
impairment to the extent the carrying value is not recoverable and the fair value is less than its carrying value. Fair value is
determined using collateral specific pricing digests, external appraisals and recent sales data from industry equipment
dealers. As market data for similar assets is available and used in the valuation, these assets are considered level 2. During
the year ended December 31, 2010, the Company recorded impairment charges of $12 million which were attributable to the
fair value of certain personal property under operating leases. No impairment was recorded during 2009.
178