Capital One 2014 Annual Report Download - page 96
Download and view the complete annual report
Please find page 96 of the 2014 Capital One annual report below. You can navigate through the pages in the report by either clicking on the pages listed below, or by using the keyword search tool below to find specific information within the annual report.-
 1
1 -
2
-
3
-
4
-
5
-
6
-
7
-
8
-
9
-
10
-
11
-
12
-
13
-
14
-
15
-
16
-
17
-
18
-
19
-
20
-
21
-
22
-
23
-
24
-
25
-
26
-
27
-
28
-
29
-
30
-
31
-
32
-
33
-
34
-
35
-
36
-
37
-
38
-
39
-
40
-
41
-
42
-
43
-
44
-
45
-
46
-
47
-
48
-
49
-
50
-
51
-
52
-
53
-
54
-
55
-
56
-
57
-
58
-
59
-
60
-
61
-
62
-
63
-
64
-
65
-
66
-
67
-
68
-
69
-
70
-
71
-
72
-
73
-
74
-
75
-
76
-
77
-
78
-
79
-
80
-
81
-
82
-
83
-
84
-
85
-
 86
86 -
 87
87 -
 88
88 -
 89
89 -
 90
90 -
 91
91 -
 92
92 -
 93
93 -
 94
94 -
 95
95 -
 96
96 -
 97
97 -
 98
98 -
 99
99 -
 100
100 -
 101
101 -
 102
102 -
 103
103 -
 104
104 -
 105
105 -
 106
106 -
107
-
108
-
109
-
110
-
111
-
112
-
113
-
114
-
115
-
116
-
117
-
118
-
119
-
120
-
121
-
122
-
123
-
124
-
125
-
126
-
127
-
128
-
129
-
130
-
131
-
132
-
133
-
134
-
135
-
136
-
137
-
138
-
139
-
140
-
141
-
142
-
143
-
144
-
145
-
146
-
147
-
148
-
149
-
150
-
151
-
152
-
153
-
154
-
155
-
156
-
157
-
158
-
159
-
160
-
161
-
162
-
163
-
164
-
165
-
166
-
167
-
168
-
169
-
170
-
171
-
172
-
173
-
174
-
175
-
176
-
177
-
178
-
179
-
180
-
181
-
182
-
183
-
184
-
185
-
186
-
187
-
188
-
189
-
190
-
191
-
192
-
193
-
194
-
195
-
196
-
197
-
198
-
199
-
200
-
201
-
202
-
203
-
204
-
205
-
206
-
207
-
208
-
209
-
210
-
211
-
212
-
213
-
214
-
215
-
216
-
217
-
218
-
219
-
220
-
221
-
222
-
223
-
224
-
225
-
226
-
227
-
228
-
229
-
230
-
231
-
232
-
233
-
234
-
235
-
236
-
237
-
238
-
239
-
240
-
241
-
242
-
243
-
244
-
245
-
246
-
247
-
248
-
249
-
250
-
251
-
252
-
253
-
254
-
255
-
256
-
257
-
258
-
259
-
260
-
261
-
262
-
263
-
264
-
265
-
266
-
267
-
268
-
269
-
270
-
271
-
272
-
273
-
274
-
275
-
276
-
277
-
278
-
279
-
280
-
281
-
282
-
283
-
284
-
285
-
286
-
287
-
288
-
289
-
290
-
291
-
292
-
293
-
294
-
295
-
296
-
297
-
298
-
299
-
300
 |
 |

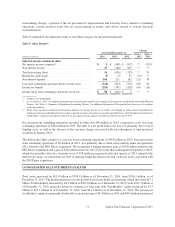
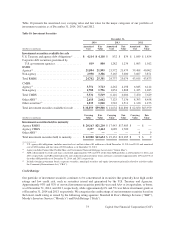
Table 11 provides information on the credit ratings of our non-agency RMBS, non-agency CMBS, other ABS and
other securities in our portfolio as of December 31, 2014 and 2013.
Table 11: Non-Agency Investment Securities Credit Ratings
December 31,
2014 2013
Below Below
Other Investment Other Investment
Amortized Investment Grade or Not Amortized Investment Grade or Not
(Dollars in millions) Cost AAA Grade Rated Cost AAA Grade Rated
Non-agency RMBS . . . $ 2,938 —% 3% 97% $ 3,165 —% 4% 96%
Non-agency CMBS . . . 1,780 100 — — 1,854 99 1 —
Other ABS . . . . . . . . . . 2,618 90 5 5 7,123 87 12 1
Other securities . . . . . . 1,035 2 88 10 1,542 9 82 9
For additional information on our investment securities, see “Note 3—Investment Securities.”
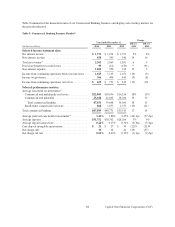
Loans Held for Investment
Total loans held for investment (“HFI”) consists of unrestricted loans and restricted loans held in our securitization
trusts. Table 12 summarizes our portfolio of loans held for investment by business segment, net of the allowance for
loan and lease losses, as of December 31, 2014 and 2013.
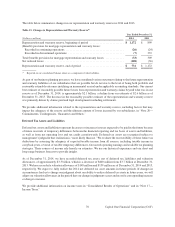
Table 12: Loans Held for Investment
December 31, 2014 December 31, 2013
(Dollars in millions) Loans Allowance Net Loans Loans Allowance Net Loans
Credit Card . . . . . . . . . . . . . . . . . . . . . . . . . . . . $ 85,876 $ 3,204 $ 82,672 $ 81,305 $ 3,214 $ 78,091
Consumer Banking . . . . . . . . . . . . . . . . . . . . . . 71,439 779 70,660 70,762 752 70,010
Commercial Banking . . . . . . . . . . . . . . . . . . . . . 50,890 395 50,495 45,011 338 44,673
Other . . . . . . . . . . . . . . . . . . . . . . . . . . . . . . . . . 111 5 106 121 11 110
Total . . . . . . . . . . . . . . . . . . . . . . . . . . . . . . . . . . $208,316 $ 4,383 $203,933 $197,199 $ 4,315 $192,884
Period-end loans held for investment increased by $11.1 billion, or 5.6%, in 2014, to $208.3 billion as of
December 31, 2014, from $197.2 billion as of December 31, 2013. The increase was primarily due to commercial
and industrial, and commercial and multifamily real estate loan growth in our Commercial Banking business, strong
growth in our domestic card loan portfolio in our Credit Card business, and strong auto loan originations outpacing
the run-off of our acquired home loan portfolio in our Consumer Banking business.
We provide additional information on the composition of our loan portfolio and credit quality below in “Credit Risk
Profile,” “MD&A—Consolidated Results of Operations” and “Note 4—Loans.”
Loans Held for Sale
Loans held for sale, which are carried at lower of cost or fair value, increased to $626 million as of December 31,
2014, from $218 million as of December 31, 2013. The increase was primarily driven by higher originations in the
Commercial Banking business and timing of sales of loans.
74 Capital One Financial Corporation (COF)