Capital One 2014 Annual Report Download - page 197
Download and view the complete annual report
Please find page 197 of the 2014 Capital One annual report below. You can navigate through the pages in the report by either clicking on the pages listed below, or by using the keyword search tool below to find specific information within the annual report.-
 1
1 -
2
-
3
-
4
-
5
-
6
-
7
-
8
-
9
-
10
-
11
-
12
-
13
-
14
-
15
-
16
-
17
-
18
-
19
-
20
-
21
-
22
-
23
-
24
-
25
-
26
-
27
-
28
-
29
-
30
-
31
-
32
-
33
-
34
-
35
-
36
-
37
-
38
-
39
-
40
-
41
-
42
-
43
-
44
-
45
-
46
-
47
-
48
-
49
-
50
-
51
-
52
-
53
-
54
-
55
-
56
-
57
-
58
-
59
-
60
-
61
-
62
-
63
-
64
-
65
-
66
-
67
-
68
-
69
-
70
-
71
-
72
-
73
-
74
-
75
-
76
-
77
-
78
-
79
-
80
-
81
-
82
-
83
-
84
-
85
-
86
-
87
-
88
-
89
-
90
-
91
-
92
-
93
-
94
-
95
-
96
-
97
-
98
-
99
-
100
-
101
-
102
-
103
-
104
-
105
-
106
-
107
-
108
-
109
-
110
-
111
-
112
-
113
-
114
-
115
-
116
-
117
-
118
-
119
-
120
-
121
-
122
-
123
-
124
-
125
-
126
-
127
-
128
-
129
-
130
-
131
-
132
-
133
-
134
-
135
-
136
-
137
-
138
-
139
-
140
-
141
-
142
-
143
-
144
-
145
-
146
-
147
-
148
-
149
-
150
-
151
-
152
-
153
-
154
-
155
-
156
-
157
-
158
-
159
-
160
-
161
-
162
-
163
-
164
-
165
-
166
-
167
-
168
-
169
-
170
-
171
-
172
-
173
-
174
-
175
-
176
-
177
-
178
-
179
-
180
-
181
-
182
-
183
-
184
-
185
-
186
-
 187
187 -
 188
188 -
 189
189 -
 190
190 -
 191
191 -
 192
192 -
 193
193 -
 194
194 -
 195
195 -
 196
196 -
 197
197 -
 198
198 -
 199
199 -
 200
200 -
 201
201 -
 202
202 -
 203
203 -
 204
204 -
 205
205 -
 206
206 -
 207
207 -
208
-
209
-
210
-
211
-
212
-
213
-
214
-
215
-
216
-
217
-
218
-
219
-
220
-
221
-
222
-
223
-
224
-
225
-
226
-
227
-
228
-
229
-
230
-
231
-
232
-
233
-
234
-
235
-
236
-
237
-
238
-
239
-
240
-
241
-
242
-
243
-
244
-
245
-
246
-
247
-
248
-
249
-
250
-
251
-
252
-
253
-
254
-
255
-
256
-
257
-
258
-
259
-
260
-
261
-
262
-
263
-
264
-
265
-
266
-
267
-
268
-
269
-
270
-
271
-
272
-
273
-
274
-
275
-
276
-
277
-
278
-
279
-
280
-
281
-
282
-
283
-
284
-
285
-
286
-
287
-
288
-
289
-
290
-
291
-
292
-
293
-
294
-
295
-
296
-
297
-
298
-
299
-
300
 |
 |

175
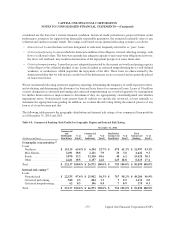
considered are the borrower’s current financial condition, historical credit performance, projected future credit
performance, prospects for support from financially responsible guarantors, the estimated realizable value of any
collateral and current economic trends. The ratings scale based on our internal risk-rating system is as follows:
•Noncriticized: Loans that have not been designated as criticized, frequently referred to as “pass” loans.
•Criticized performing: Loans in which the financial condition of the obligor is stressed, affecting earnings, cash
flows or collateral values. The borrower currently has adequate capacity to meet near-term obligations; however,
the stress, left unabated, may result in deterioration of the repayment prospects at some future date.
•Criticized nonperforming: Loans that are not adequately protected by the current net worth and paying capacity
of the obligor or the collateral pledged, if any. Loans classified as criticized nonperforming have a well-defined
weakness, or weaknesses, which jeopardize the repayment of the debt. These loans are characterized by the
distinct possibility that we will sustain a credit loss if the deficiencies are not corrected and are generally placed
on nonaccrual status.
We use our internal risk-rating system for regulatory reporting, determining the frequency of credit exposure reviews,
and evaluating and determining the allowance for loan and lease losses for commercial loans. Loans of $1 million
or more designated as criticized performing and criticized nonperforming are reviewed quarterly by management
for further deterioration or improvement to determine if they are appropriately classified/graded and whether
impairment exists. Noncriticized loans greater than $1 million are specifically reviewed, at least annually, to
determine the appropriate loan grading. In addition, we evaluate the risk rating during the renewal process of any
loan or if a loan becomes past due.
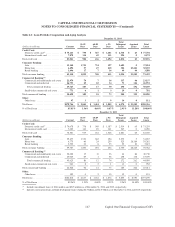
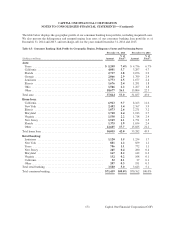
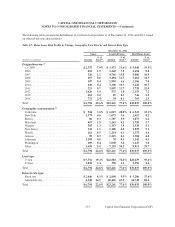
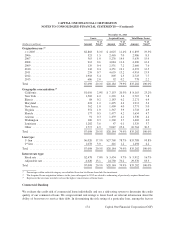
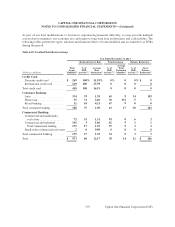
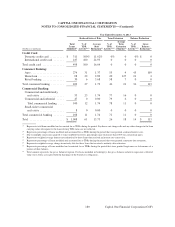
The following table presents the geographic distribution and internal risk ratings of our commercial loan portfolio
as of December 31, 2014 and 2013.
Table 4.8: Commercial Banking: Risk Profile by Geographic Region and Internal Risk Rating
December 31, 2014
Commercial
and Commercial Small-ticket Total
Multifamily % of and % of Commercial % of Commercial % of
(Dollars in millions) Real Estate Total(1) Industrial Total(1) Real Estate Total(1) Banking Total(1)
Geographic concentration:(2)
Loans:
Northeast . . . . . . . . . . . . . . . $ 15,135 65.4% $ 6,384 23.7% $ 478 61.2% $ 21,997 43.2%
Mid-Atlantic . . . . . . . . . . . . . 2,491 10.8 2,121 7.9 30 3.8 4,642 9.1
South . . . . . . . . . . . . . . . . . . 3,070 13.3 12,310 45.6 48 6.2 15,428 30.3
Other . . . . . . . . . . . . . . . . . . . 2,441 10.5 6,157 22.8 225 28.8 8,823 17.4
Total . . . . . . . . . . . . . . . . . . . . . $ 23,137 100.0% $ 26,972 100.0% $ 781 100.0% $ 50,890 100.0%
Internal risk rating:(3)
Loans:
Noncriticized . . . . . . . . . . . . $ 22,535 97.4% $ 25,982 96.3% $ 767 98.2% $ 49,284 96.9%
Criticized performing . . . . . . 540 2.3 884 3.3 7 0.9 1,431 2.8
Criticized nonperforming . . . 62 0.3 106 0.4 7 0.9 175 0.3
Total . . . . . . . . . . . . . . . . . . . . . $ 23,137 100.0% $ 26,972 100.0% $ 781 100.0% $ 50,890 100.0%
CAPITAL ONE FINANCIAL CORPORATION
NOTES TO CONSOLIDATED FINANCIAL STATEMENTS—(Continued)
Capital One Financial Corporation (COF)