Capital One 2014 Annual Report Download - page 200
Download and view the complete annual report
Please find page 200 of the 2014 Capital One annual report below. You can navigate through the pages in the report by either clicking on the pages listed below, or by using the keyword search tool below to find specific information within the annual report.-
 1
1 -
2
-
3
-
4
-
5
-
6
-
7
-
8
-
9
-
10
-
11
-
12
-
13
-
14
-
15
-
16
-
17
-
18
-
19
-
20
-
21
-
22
-
23
-
24
-
25
-
26
-
27
-
28
-
29
-
30
-
31
-
32
-
33
-
34
-
35
-
36
-
37
-
38
-
39
-
40
-
41
-
42
-
43
-
44
-
45
-
46
-
47
-
48
-
49
-
50
-
51
-
52
-
53
-
54
-
55
-
56
-
57
-
58
-
59
-
60
-
61
-
62
-
63
-
64
-
65
-
66
-
67
-
68
-
69
-
70
-
71
-
72
-
73
-
74
-
75
-
76
-
77
-
78
-
79
-
80
-
81
-
82
-
83
-
84
-
85
-
86
-
87
-
88
-
89
-
90
-
91
-
92
-
93
-
94
-
95
-
96
-
97
-
98
-
99
-
100
-
101
-
102
-
103
-
104
-
105
-
106
-
107
-
108
-
109
-
110
-
111
-
112
-
113
-
114
-
115
-
116
-
117
-
118
-
119
-
120
-
121
-
122
-
123
-
124
-
125
-
126
-
127
-
128
-
129
-
130
-
131
-
132
-
133
-
134
-
135
-
136
-
137
-
138
-
139
-
140
-
141
-
142
-
143
-
144
-
145
-
146
-
147
-
148
-
149
-
150
-
151
-
152
-
153
-
154
-
155
-
156
-
157
-
158
-
159
-
160
-
161
-
162
-
163
-
164
-
165
-
166
-
167
-
168
-
169
-
170
-
171
-
172
-
173
-
174
-
175
-
176
-
177
-
178
-
179
-
180
-
181
-
182
-
183
-
184
-
185
-
186
-
187
-
188
-
189
-
 190
190 -
 191
191 -
 192
192 -
 193
193 -
 194
194 -
 195
195 -
 196
196 -
 197
197 -
 198
198 -
 199
199 -
 200
200 -
 201
201 -
 202
202 -
 203
203 -
 204
204 -
 205
205 -
 206
206 -
 207
207 -
 208
208 -
 209
209 -
 210
210 -
211
-
212
-
213
-
214
-
215
-
216
-
217
-
218
-
219
-
220
-
221
-
222
-
223
-
224
-
225
-
226
-
227
-
228
-
229
-
230
-
231
-
232
-
233
-
234
-
235
-
236
-
237
-
238
-
239
-
240
-
241
-
242
-
243
-
244
-
245
-
246
-
247
-
248
-
249
-
250
-
251
-
252
-
253
-
254
-
255
-
256
-
257
-
258
-
259
-
260
-
261
-
262
-
263
-
264
-
265
-
266
-
267
-
268
-
269
-
270
-
271
-
272
-
273
-
274
-
275
-
276
-
277
-
278
-
279
-
280
-
281
-
282
-
283
-
284
-
285
-
286
-
287
-
288
-
289
-
290
-
291
-
292
-
293
-
294
-
295
-
296
-
297
-
298
-
299
-
300
 |
 |

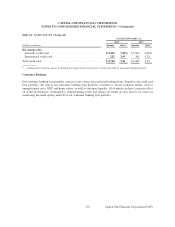
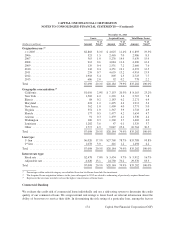
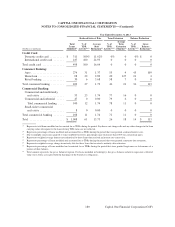
178
Year Ended December 31,
2014 2013
Average Interest Average Interest
Recorded Income Recorded Income
(Dollars in millions) Investment Recognized Investment Recognized
Credit Card:
Domestic credit card . . . . . . . . . . . . . . . . . . . . . . . . . . . . . . . . . . . $ 571 $ 58 $ 647 $ 66
International credit card . . . . . . . . . . . . . . . . . . . . . . . . . . . . . . . . 160 11 170 11
Total credit card(2) . . . . . . . . . . . . . . . . . . . . . . . . . . . . . . . . . . . . . . . 731 69 817 77
Consumer Banking:
Auto(3) . . . . . . . . . . . . . . . . . . . . . . . . . . . . . . . . . . . . . . . . . . . . . . 387 72 335 62
Home loan . . . . . . . . . . . . . . . . . . . . . . . . . . . . . . . . . . . . . . . . . . . 388 5 418 7
Retail banking . . . . . . . . . . . . . . . . . . . . . . . . . . . . . . . . . . . . . . . . 69 2 92 1
Total consumer banking . . . . . . . . . . . . . . . . . . . . . . . . . . . . . . . . . . 844 79 845 70
Commercial Banking:
Commercial and multifamily real estate . . . . . . . . . . . . . . . . . . . . 175 6 217 1
Commercial and industrial . . . . . . . . . . . . . . . . . . . . . . . . . . . . . . 185 4 219 1
Total commercial lending . . . . . . . . . . . . . . . . . . . . . . . . . . . . . 360 10 436 2
Small-ticket commercial real estate . . . . . . . . . . . . . . . . . . . . . . . 8016 0
Total commercial banking . . . . . . . . . . . . . . . . . . . . . . . . . . . . . . . . 368 10 452 2
Total . . . . . . . . . . . . . . . . . . . . . . . . . . . . . . . . . . . . . . . . . . . . . . . . . $ 1,943 $ 158 $ 2,114 $ 149
(1) Impaired loans include TDRs, all commercial nonperforming loans, and home loans nonperforming loans with a specific impairment.
(2) Credit card loans include finance charges and fees.
(3) Although auto loans from loan recovery inventory are not reported in our loans held for investment, they are included as impaired loans
above since they are reported as TDRs.
TDRs accounted for $1.7 billion of impaired loans as of both December 31, 2014 and 2013. Consumer TDRs
classified as performing totaled $1.0 billion and $1.1 billion as of December 31, 2014 and 2013, respectively.
Commercial TDRs classified as performing totaled $194 million and $180 million as of December 31, 2014 and
2013, respectively.
CAPITAL ONE FINANCIAL CORPORATION
NOTES TO CONSOLIDATED FINANCIAL STATEMENTS—(Continued)
Capital One Financial Corporation (COF)