Capital One 2014 Annual Report Download - page 121
Download and view the complete annual report
Please find page 121 of the 2014 Capital One annual report below. You can navigate through the pages in the report by either clicking on the pages listed below, or by using the keyword search tool below to find specific information within the annual report.-
 1
1 -
2
-
3
-
4
-
5
-
6
-
7
-
8
-
9
-
10
-
11
-
12
-
13
-
14
-
15
-
16
-
17
-
18
-
19
-
20
-
21
-
22
-
23
-
24
-
25
-
26
-
27
-
28
-
29
-
30
-
31
-
32
-
33
-
34
-
35
-
36
-
37
-
38
-
39
-
40
-
41
-
42
-
43
-
44
-
45
-
46
-
47
-
48
-
49
-
50
-
51
-
52
-
53
-
54
-
55
-
56
-
57
-
58
-
59
-
60
-
61
-
62
-
63
-
64
-
65
-
66
-
67
-
68
-
69
-
70
-
71
-
72
-
73
-
74
-
75
-
76
-
77
-
78
-
79
-
80
-
81
-
82
-
83
-
84
-
85
-
86
-
87
-
88
-
89
-
90
-
91
-
92
-
93
-
94
-
95
-
96
-
97
-
98
-
99
-
100
-
101
-
102
-
103
-
104
-
105
-
106
-
107
-
108
-
109
-
110
-
 111
111 -
 112
112 -
 113
113 -
 114
114 -
 115
115 -
 116
116 -
 117
117 -
 118
118 -
 119
119 -
 120
120 -
 121
121 -
 122
122 -
 123
123 -
 124
124 -
 125
125 -
 126
126 -
 127
127 -
 128
128 -
 129
129 -
 130
130 -
 131
131 -
132
-
133
-
134
-
135
-
136
-
137
-
138
-
139
-
140
-
141
-
142
-
143
-
144
-
145
-
146
-
147
-
148
-
149
-
150
-
151
-
152
-
153
-
154
-
155
-
156
-
157
-
158
-
159
-
160
-
161
-
162
-
163
-
164
-
165
-
166
-
167
-
168
-
169
-
170
-
171
-
172
-
173
-
174
-
175
-
176
-
177
-
178
-
179
-
180
-
181
-
182
-
183
-
184
-
185
-
186
-
187
-
188
-
189
-
190
-
191
-
192
-
193
-
194
-
195
-
196
-
197
-
198
-
199
-
200
-
201
-
202
-
203
-
204
-
205
-
206
-
207
-
208
-
209
-
210
-
211
-
212
-
213
-
214
-
215
-
216
-
217
-
218
-
219
-
220
-
221
-
222
-
223
-
224
-
225
-
226
-
227
-
228
-
229
-
230
-
231
-
232
-
233
-
234
-
235
-
236
-
237
-
238
-
239
-
240
-
241
-
242
-
243
-
244
-
245
-
246
-
247
-
248
-
249
-
250
-
251
-
252
-
253
-
254
-
255
-
256
-
257
-
258
-
259
-
260
-
261
-
262
-
263
-
264
-
265
-
266
-
267
-
268
-
269
-
270
-
271
-
272
-
273
-
274
-
275
-
276
-
277
-
278
-
279
-
280
-
281
-
282
-
283
-
284
-
285
-
286
-
287
-
288
-
289
-
290
-
291
-
292
-
293
-
294
-
295
-
296
-
297
-
298
-
299
-
300
 |
 |
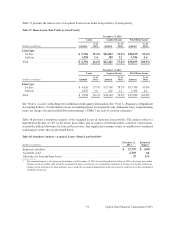
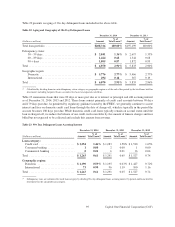
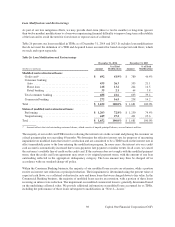
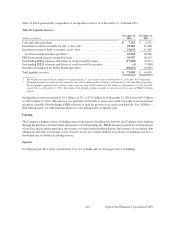
Impaired Loans
A loan is considered impaired when, based on current information and events, it is probable that we will be unable
to collect all amounts due from the borrower in accordance with the original contractual terms of the loan. Generally,
we report loans as impaired based on the method for measuring impairment in accordance with applicable accounting
guidance. Loans defined as individually impaired include larger balance commercial nonperforming loans and TDRs.
Loans held for sale are not reported as impaired, as these loans are recorded at lower of cost or fair value. Impaired
loans also exclude Acquired Loans accounted for based on expected cash flows because this accounting methodology
takes into consideration future credit losses expected to be incurred, as discussed above under “Summary of Selected
Financial Data.”
Impaired loans, including TDRs, totaled $1.9 billion as of both December 31, 2014 and 2013. TDRs accounted for
$1.7 billion of impaired loans as of both December 31, 2014 and 2013. We provide additional information on our
impaired loans, including the allowance for loan and lease losses established for these loans, in “Note 4—Loans”
and “Note 5—Allowance for Loan and Lease Losses.”
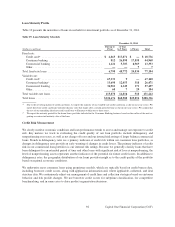
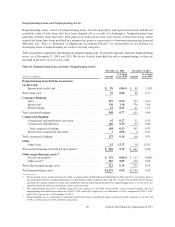
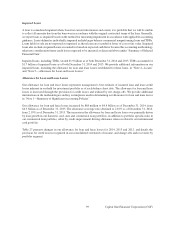
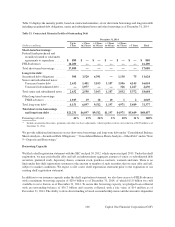
Allowance for Loan and Lease Losses
Our allowance for loan and lease losses represents management’s best estimate of incurred loan and lease credit
losses inherent in our held for investment portfolio as of each balance sheet date. The allowance for loan and lease
losses is increased through the provision for credit losses and reduced by net charge-offs. We provide additional
information on the methodologies and key assumptions used in determining our allowance for loan and lease losses
in “Note 1—Summary of Significant Accounting Policies.”
Our allowance for loan and lease losses increased by $68 million to $4.4 billion as of December 31, 2014, from
$4.3 billion as of December 31, 2013. The allowance coverage ratio declined to 2.10% as of December 31, 2014,
from 2.19% as of December 31, 2013. The increase in the allowance for loan and lease losses was primarily driven
by loan growth in our domestic card, auto and commercial loan portfolios, in addition to portfolio specific risks in
our commercial loan portfolio, offset by credit improvement driving allowance releases related to our international
card portfolio.
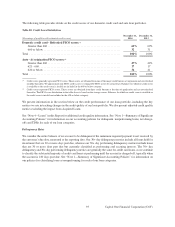
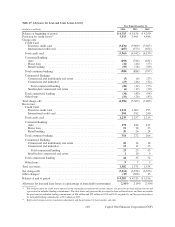
Table 27 presents changes in our allowance for loan and lease losses for 2014, 2013 and 2012, and details the
provision for credit losses recognized in our consolidated statements of income, and charge-offs and recoveries by
portfolio segment.
99 Capital One Financial Corporation (COF)