Capital One 2014 Annual Report Download - page 90
Download and view the complete annual report
Please find page 90 of the 2014 Capital One annual report below. You can navigate through the pages in the report by either clicking on the pages listed below, or by using the keyword search tool below to find specific information within the annual report.-
 1
1 -
2
-
3
-
4
-
5
-
6
-
7
-
8
-
9
-
10
-
11
-
12
-
13
-
14
-
15
-
16
-
17
-
18
-
19
-
20
-
21
-
22
-
23
-
24
-
25
-
26
-
27
-
28
-
29
-
30
-
31
-
32
-
33
-
34
-
35
-
36
-
37
-
38
-
39
-
40
-
41
-
42
-
43
-
44
-
45
-
46
-
47
-
48
-
49
-
50
-
51
-
52
-
53
-
54
-
55
-
56
-
57
-
58
-
59
-
60
-
61
-
62
-
63
-
64
-
65
-
66
-
67
-
68
-
69
-
70
-
71
-
72
-
73
-
74
-
75
-
76
-
77
-
78
-
79
-
 80
80 -
 81
81 -
 82
82 -
 83
83 -
 84
84 -
 85
85 -
 86
86 -
 87
87 -
 88
88 -
 89
89 -
 90
90 -
 91
91 -
 92
92 -
 93
93 -
 94
94 -
 95
95 -
 96
96 -
 97
97 -
 98
98 -
 99
99 -
 100
100 -
101
-
102
-
103
-
104
-
105
-
106
-
107
-
108
-
109
-
110
-
111
-
112
-
113
-
114
-
115
-
116
-
117
-
118
-
119
-
120
-
121
-
122
-
123
-
124
-
125
-
126
-
127
-
128
-
129
-
130
-
131
-
132
-
133
-
134
-
135
-
136
-
137
-
138
-
139
-
140
-
141
-
142
-
143
-
144
-
145
-
146
-
147
-
148
-
149
-
150
-
151
-
152
-
153
-
154
-
155
-
156
-
157
-
158
-
159
-
160
-
161
-
162
-
163
-
164
-
165
-
166
-
167
-
168
-
169
-
170
-
171
-
172
-
173
-
174
-
175
-
176
-
177
-
178
-
179
-
180
-
181
-
182
-
183
-
184
-
185
-
186
-
187
-
188
-
189
-
190
-
191
-
192
-
193
-
194
-
195
-
196
-
197
-
198
-
199
-
200
-
201
-
202
-
203
-
204
-
205
-
206
-
207
-
208
-
209
-
210
-
211
-
212
-
213
-
214
-
215
-
216
-
217
-
218
-
219
-
220
-
221
-
222
-
223
-
224
-
225
-
226
-
227
-
228
-
229
-
230
-
231
-
232
-
233
-
234
-
235
-
236
-
237
-
238
-
239
-
240
-
241
-
242
-
243
-
244
-
245
-
246
-
247
-
248
-
249
-
250
-
251
-
252
-
253
-
254
-
255
-
256
-
257
-
258
-
259
-
260
-
261
-
262
-
263
-
264
-
265
-
266
-
267
-
268
-
269
-
270
-
271
-
272
-
273
-
274
-
275
-
276
-
277
-
278
-
279
-
280
-
281
-
282
-
283
-
284
-
285
-
286
-
287
-
288
-
289
-
290
-
291
-
292
-
293
-
294
-
295
-
296
-
297
-
298
-
299
-
300
 |
 |

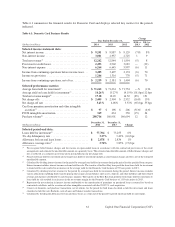
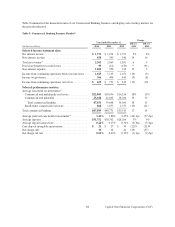
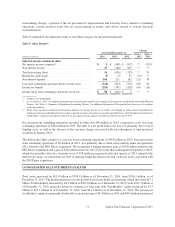
Table 8 summarizes the financial results of our Commercial Banking business and displays selected key metrics for
the periods indicated.
Table 8: Commercial Banking Business Results(1)
Change
Year Ended December 31, 2014 vs. 2013 vs.
(Dollars in millions) 2014 2013 2012 2013 2012
Selected income statement data:
Net interest income . . . . . . . . . . . . . . . . . . . . . . . . . . . . . . . $ 1,751 $ 1,674 $ 1,551 5% 8%
Non-interest income . . . . . . . . . . . . . . . . . . . . . . . . . . . . . . 450 395 340 14 16
Total net revenue
(2)
. . . . . . . . . . . . . . . . . . . . . . . . . . . . . . . 2,201 2,069 1,891 6 9
Provision (benefit) for credit losses . . . . . . . . . . . . . . . . . . 93 (24) (270) ** (91)
Non-interest expense . . . . . . . . . . . . . . . . . . . . . . . . . . . . . . 1,083 958 910 13 5
Income from continuing operations before income taxes . . 1,025 1,135 1,251 (10) (9)
Income tax provision . . . . . . . . . . . . . . . . . . . . . . . . . . . . . . 366 404 441 (9) (8)
Income from continuing operations, net of tax . . . . . . . . . . $ 659 $ 731 $ 810 (10) (10)
Selected performance metrics:
Average loans held for investment:
(3)
Commercial and multifamily real estate . . . . . . . . . . . . . $22,003 $18,636 $16,256 18% 15%
Commercial and industrial . . . . . . . . . . . . . . . . . . . . . . . 25,028 21,062 18,304 19 15
Total commercial lending . . . . . . . . . . . . . . . . . . . . . . 47,031 39,698 34,560 18 15
Small-ticket commercial real estate . . . . . . . . . . . . . . . . 868 1,073 1,353 (19) (21)
Total commercial banking . . . . . . . . . . . . . . . . . . . . . . . . . . $47,899 $40,771 $35,913 17 14
Average yield on loans held for investment(2) . . . . . . . . . . . 3.42% 3.88% 4.25% (46) bps (37) bps
Average deposits . . . . . . . . . . . . . . . . . . . . . . . . . . . . . . . . . $31,752 $30,702 $28,266 3% 9%
Average deposit interest rate . . . . . . . . . . . . . . . . . . . . . . . . 0.24% 0.27% 0.32% (3) bps (5) bps
Core deposit intangible amortization . . . . . . . . . . . . . . . . . $ 21 $ 27 $ 34 (22)% (21)%
Net charge-offs . . . . . . . . . . . . . . . . . . . . . . . . . . . . . . . . . . 10 14 42 (29) (67)
Net charge-off rate . . . . . . . . . . . . . . . . . . . . . . . . . . . . . . . 0.02% 0.03% 0.12% (1) bps (9) bps
68 Capital One Financial Corporation (COF)