Capital One 2014 Annual Report Download - page 94
Download and view the complete annual report
Please find page 94 of the 2014 Capital One annual report below. You can navigate through the pages in the report by either clicking on the pages listed below, or by using the keyword search tool below to find specific information within the annual report.-
 1
1 -
2
-
3
-
4
-
5
-
6
-
7
-
8
-
9
-
10
-
11
-
12
-
13
-
14
-
15
-
16
-
17
-
18
-
19
-
20
-
21
-
22
-
23
-
24
-
25
-
26
-
27
-
28
-
29
-
30
-
31
-
32
-
33
-
34
-
35
-
36
-
37
-
38
-
39
-
40
-
41
-
42
-
43
-
44
-
45
-
46
-
47
-
48
-
49
-
50
-
51
-
52
-
53
-
54
-
55
-
56
-
57
-
58
-
59
-
60
-
61
-
62
-
63
-
64
-
65
-
66
-
67
-
68
-
69
-
70
-
71
-
72
-
73
-
74
-
75
-
76
-
77
-
78
-
79
-
80
-
81
-
82
-
83
-
 84
84 -
 85
85 -
 86
86 -
 87
87 -
 88
88 -
 89
89 -
 90
90 -
 91
91 -
 92
92 -
 93
93 -
 94
94 -
 95
95 -
 96
96 -
 97
97 -
 98
98 -
 99
99 -
 100
100 -
 101
101 -
 102
102 -
 103
103 -
 104
104 -
105
-
106
-
107
-
108
-
109
-
110
-
111
-
112
-
113
-
114
-
115
-
116
-
117
-
118
-
119
-
120
-
121
-
122
-
123
-
124
-
125
-
126
-
127
-
128
-
129
-
130
-
131
-
132
-
133
-
134
-
135
-
136
-
137
-
138
-
139
-
140
-
141
-
142
-
143
-
144
-
145
-
146
-
147
-
148
-
149
-
150
-
151
-
152
-
153
-
154
-
155
-
156
-
157
-
158
-
159
-
160
-
161
-
162
-
163
-
164
-
165
-
166
-
167
-
168
-
169
-
170
-
171
-
172
-
173
-
174
-
175
-
176
-
177
-
178
-
179
-
180
-
181
-
182
-
183
-
184
-
185
-
186
-
187
-
188
-
189
-
190
-
191
-
192
-
193
-
194
-
195
-
196
-
197
-
198
-
199
-
200
-
201
-
202
-
203
-
204
-
205
-
206
-
207
-
208
-
209
-
210
-
211
-
212
-
213
-
214
-
215
-
216
-
217
-
218
-
219
-
220
-
221
-
222
-
223
-
224
-
225
-
226
-
227
-
228
-
229
-
230
-
231
-
232
-
233
-
234
-
235
-
236
-
237
-
238
-
239
-
240
-
241
-
242
-
243
-
244
-
245
-
246
-
247
-
248
-
249
-
250
-
251
-
252
-
253
-
254
-
255
-
256
-
257
-
258
-
259
-
260
-
261
-
262
-
263
-
264
-
265
-
266
-
267
-
268
-
269
-
270
-
271
-
272
-
273
-
274
-
275
-
276
-
277
-
278
-
279
-
280
-
281
-
282
-
283
-
284
-
285
-
286
-
287
-
288
-
289
-
290
-
291
-
292
-
293
-
294
-
295
-
296
-
297
-
298
-
299
-
300
 |
 |
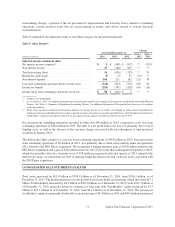
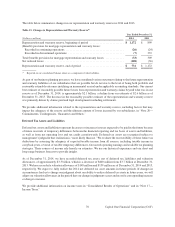
stock issuances during 2014, partially offset by $2.0 billion of share repurchases under the 2014 Stock Repurchase
Program and dividend payments of $747 million.
The following is a discussion of material changes in the major components of our assets and liabilities during 2014.
Period-end balance sheet amounts may vary from average balance sheet amounts due to liquidity and balance sheet
management activities that are intended to ensure the adequacy of capital while managing our liquidity requirements
for the Company and our customers and our market risk exposure in accordance with our risk appetite.
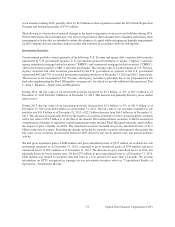
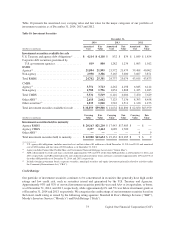
Investment Securities
Our investment portfolio consists primarily of the following: U.S. Treasury and agency debt; corporate debt securities
guaranteed by U.S. government agencies; U.S. government-sponsored enterprise or agency (“Agency”) and non-
agency residential mortgage-backed securities (“RMBS”) and commercial mortgage-backed securities (“CMBS”);
other asset-backed securities (“ABS”); and other investments. The carrying value of our investments in U.S. Treasury,
Agency securities and other securities guaranteed by the U.S. government or agencies of the U.S. government
represented 86% and 77% of our total investment securities portfolio as of December 31, 2014 and 2013, respectively.
The increase in our investment in U.S. Treasury and Agency securities is primarily due to our preparation for the
final rules implementing the Basel III liquidity coverage ratio, for which we provide additional information in “Part
I—Item 1. Business—Supervision and Regulation.”
During 2014, the fair value of our investment portfolio increased by $2.1 billion, or 4%, to $63.1 billion as of
December 31, 2014 from $61.0 billion as of December 31, 2013. This increase was primarily driven by lower market
interest rates.
During 2013, the fair value of our investment portfolio decreased by $3.0 billion, or 5%, to $61.0 billion as of
December 31, 2013 from $64.0 billion as of December 31, 2012. The fair value of our securities available for sale
portfolio was $41.8 billion as of December 31, 2013, a $22.2 billion decrease from $64.0 billion as of December 31,
2012. This decrease was primarily driven by the transfer of securities available for sale to securities held to maturity
with a fair value of $18.3 billion as of the date of the transfer. We transferred these securities to held to maturity in
consideration of changes to regulatory capital requirements under the final Basel III capital standards, and to reduce
the impact of price volatility on AOCI. The transferred securities included net pre-tax unrealized losses of $1.5
billion at the date of transfer. Excluding the change on the held to maturity securities subsequent to the transfer, the
fair value of our securities decreased $4 billion in 2013 driven by the rise in interest rates and normal portfolio
activity.
We had gross unrealized gains of $886 million and gross unrealized losses of $237 million on available-for sale
investment securities as of December 31, 2014, compared to gross unrealized gains of $799 million and gross
unrealized losses of $631 million as of December 31, 2013. The decrease in gross unrealized losses in 2014 was
primarily driven by lower interest rates. Of the $237 million in gross unrealized losses as of December 31, 2014,
$206 million was related to securities that had been in a loss position for more than 12 months. We provide
information on OTTI recognized in earnings on our investment securities above in “Consolidated Results of
Operations—Non-Interest Income.”
72 Capital One Financial Corporation (COF)