Capital One 2014 Annual Report Download - page 125
Download and view the complete annual report
Please find page 125 of the 2014 Capital One annual report below. You can navigate through the pages in the report by either clicking on the pages listed below, or by using the keyword search tool below to find specific information within the annual report.-
 1
1 -
2
-
3
-
4
-
5
-
6
-
7
-
8
-
9
-
10
-
11
-
12
-
13
-
14
-
15
-
16
-
17
-
18
-
19
-
20
-
21
-
22
-
23
-
24
-
25
-
26
-
27
-
28
-
29
-
30
-
31
-
32
-
33
-
34
-
35
-
36
-
37
-
38
-
39
-
40
-
41
-
42
-
43
-
44
-
45
-
46
-
47
-
48
-
49
-
50
-
51
-
52
-
53
-
54
-
55
-
56
-
57
-
58
-
59
-
60
-
61
-
62
-
63
-
64
-
65
-
66
-
67
-
68
-
69
-
70
-
71
-
72
-
73
-
74
-
75
-
76
-
77
-
78
-
79
-
80
-
81
-
82
-
83
-
84
-
85
-
86
-
87
-
88
-
89
-
90
-
91
-
92
-
93
-
94
-
95
-
96
-
97
-
98
-
99
-
100
-
101
-
102
-
103
-
104
-
105
-
106
-
107
-
108
-
109
-
110
-
111
-
112
-
113
-
114
-
 115
115 -
 116
116 -
 117
117 -
 118
118 -
 119
119 -
 120
120 -
 121
121 -
 122
122 -
 123
123 -
 124
124 -
 125
125 -
 126
126 -
 127
127 -
 128
128 -
 129
129 -
 130
130 -
 131
131 -
 132
132 -
 133
133 -
 134
134 -
 135
135 -
136
-
137
-
138
-
139
-
140
-
141
-
142
-
143
-
144
-
145
-
146
-
147
-
148
-
149
-
150
-
151
-
152
-
153
-
154
-
155
-
156
-
157
-
158
-
159
-
160
-
161
-
162
-
163
-
164
-
165
-
166
-
167
-
168
-
169
-
170
-
171
-
172
-
173
-
174
-
175
-
176
-
177
-
178
-
179
-
180
-
181
-
182
-
183
-
184
-
185
-
186
-
187
-
188
-
189
-
190
-
191
-
192
-
193
-
194
-
195
-
196
-
197
-
198
-
199
-
200
-
201
-
202
-
203
-
204
-
205
-
206
-
207
-
208
-
209
-
210
-
211
-
212
-
213
-
214
-
215
-
216
-
217
-
218
-
219
-
220
-
221
-
222
-
223
-
224
-
225
-
226
-
227
-
228
-
229
-
230
-
231
-
232
-
233
-
234
-
235
-
236
-
237
-
238
-
239
-
240
-
241
-
242
-
243
-
244
-
245
-
246
-
247
-
248
-
249
-
250
-
251
-
252
-
253
-
254
-
255
-
256
-
257
-
258
-
259
-
260
-
261
-
262
-
263
-
264
-
265
-
266
-
267
-
268
-
269
-
270
-
271
-
272
-
273
-
274
-
275
-
276
-
277
-
278
-
279
-
280
-
281
-
282
-
283
-
284
-
285
-
286
-
287
-
288
-
289
-
290
-
291
-
292
-
293
-
294
-
295
-
296
-
297
-
298
-
299
-
300
 |
 |

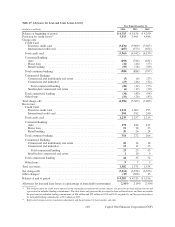
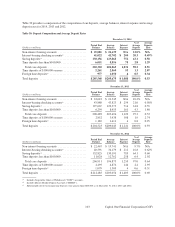
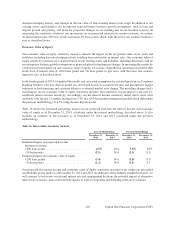
Table 30 provides a comparison of the composition of our deposits, average balances, interest expense and average
deposit rates for 2014, 2013 and 2012.
Table 30: Deposit Composition and Average Deposit Rates
December 31, 2014
% of Average
Period End Average Interest Average Deposits
(Dollars in millions) Balance Balance Expense Deposit Rate
Non-interest bearing accounts . . . . . . . . . . . . . . . . . . . . $ 25,081 $ 24,639 N/A 12.0% N/A
Interest-bearing checking accounts(1) . . . . . . . . . . . . . . . 41,022 41,702 $ 204 20.3 0.49%
Saving deposits(2) . . . . . . . . . . . . . . . . . . . . . . . . . . . . . . . 130,156 129,868 752 63.1 0.58
Time deposits less than $100,000 . . . . . . . . . . . . . . . . . . 6,051 5,856 75 2.8 1.29
Total core deposits . . . . . . . . . . . . . . . . . . . . . . . . . . . 202,310 202,065 1,031 98.2 0.51
Time deposits of $100,000 or more . . . . . . . . . . . . . . . . 2,261 2,560 53 1.3 2.07
Foreign time deposits(3) . . . . . . . . . . . . . . . . . . . . . . . . . . 977 1,050 4 0.5 0.34
Total deposits . . . . . . . . . . . . . . . . . . . . . . . . . . . . . . . . . $ 205,548 $205,675 $ 1,088 100.0% 0.53
December 31, 2013
% of Average
Period End Average Interest Average Deposits
(Dollars in millions) Balance Balance Expense Deposit Rate
Non-interest bearing accounts . . . . . . . . . . . . . . . . . . . . $ 22,643 $ 21,345 N/A 10.2% N/A
Interest-bearing checking accounts(1) . . . . . . . . . . . . . . . 43,880 43,823 $ 254 21.0 0.58%
Saving deposits(2) . . . . . . . . . . . . . . . . . . . . . . . . . . . . . . . 127,667 129,373 714 61.8 0.55
Time deposits less than $100,000 . . . . . . . . . . . . . . . . . . 6,299 8,955 161 4.3 1.80
Total core deposits . . . . . . . . . . . . . . . . . . . . . . . . . . . 200,489 203,496 1,129 97.3 0.55
Time deposits of $100,000 or more . . . . . . . . . . . . . . . . 2,852 3,938 108 1.9 2.74
Foreign time deposits(3) . . . . . . . . . . . . . . . . . . . . . . . . . . 1,182 1,611 4 0.8 0.25
Total deposits . . . . . . . . . . . . . . . . . . . . . . . . . . . . . . . . . $ 204,523 $209,045 $ 1,241 100.0% 0.59
December 31, 2012
% of Average
Period End Average Interest Average Deposits
(Dollars in millions) Balance Balance Expense Deposit Rate
Non-interest bearing accounts . . . . . . . . . . . . . . . . . . . . $ 22,467 $ 19,741 N/A 9.7% N/A
Interest-bearing checking accounts(1) . . . . . . . . . . . . . . . 40,591 34,179 $ 212 16.8 0.62%
Saving deposits(2) . . . . . . . . . . . . . . . . . . . . . . . . . . . . . . . 132,825 130,191 785 64.1 0.60
Time deposits less than $100,000 . . . . . . . . . . . . . . . . . . 11,028 12,762 258 6.4 2.02
Total core deposits . . . . . . . . . . . . . . . . . . . . . . . . . . . 206,911 196,873 1,255 97.0 0.64
Time deposits of $100,000 or more . . . . . . . . . . . . . . . . 4,495 4,876 144 2.4 2.95
Foreign time deposits(3) . . . . . . . . . . . . . . . . . . . . . . . . . . 1,079 1,305 4 0.6 0.31
Total deposits . . . . . . . . . . . . . . . . . . . . . . . . . . . . . . . . . $ 212,485 $203,054 $ 1,403 100.0% 0.69
(1) Includes Negotiable Order of Withdrawal (“NOW”) accounts.
(2) Includes Money Market Deposit Accounts (“MMDA”).
(3) Substantially all of our foreign time deposits were greater than $100,000 as of December 31, 2014, 2013 and 2012.
103 Capital One Financial Corporation (COF)