Capital One 2014 Annual Report Download - page 60
Download and view the complete annual report
Please find page 60 of the 2014 Capital One annual report below. You can navigate through the pages in the report by either clicking on the pages listed below, or by using the keyword search tool below to find specific information within the annual report.-
 1
1 -
2
-
3
-
4
-
5
-
6
-
7
-
8
-
9
-
10
-
11
-
12
-
13
-
14
-
15
-
16
-
17
-
18
-
19
-
20
-
21
-
22
-
23
-
24
-
25
-
26
-
27
-
28
-
29
-
30
-
31
-
32
-
33
-
34
-
35
-
36
-
37
-
38
-
39
-
40
-
41
-
42
-
43
-
44
-
45
-
46
-
47
-
48
-
49
-
 50
50 -
 51
51 -
 52
52 -
 53
53 -
 54
54 -
 55
55 -
 56
56 -
 57
57 -
 58
58 -
 59
59 -
 60
60 -
 61
61 -
 62
62 -
 63
63 -
 64
64 -
 65
65 -
 66
66 -
 67
67 -
 68
68 -
 69
69 -
 70
70 -
71
-
72
-
73
-
74
-
75
-
76
-
77
-
78
-
79
-
80
-
81
-
82
-
83
-
84
-
85
-
86
-
87
-
88
-
89
-
90
-
91
-
92
-
93
-
94
-
95
-
96
-
97
-
98
-
99
-
100
-
101
-
102
-
103
-
104
-
105
-
106
-
107
-
108
-
109
-
110
-
111
-
112
-
113
-
114
-
115
-
116
-
117
-
118
-
119
-
120
-
121
-
122
-
123
-
124
-
125
-
126
-
127
-
128
-
129
-
130
-
131
-
132
-
133
-
134
-
135
-
136
-
137
-
138
-
139
-
140
-
141
-
142
-
143
-
144
-
145
-
146
-
147
-
148
-
149
-
150
-
151
-
152
-
153
-
154
-
155
-
156
-
157
-
158
-
159
-
160
-
161
-
162
-
163
-
164
-
165
-
166
-
167
-
168
-
169
-
170
-
171
-
172
-
173
-
174
-
175
-
176
-
177
-
178
-
179
-
180
-
181
-
182
-
183
-
184
-
185
-
186
-
187
-
188
-
189
-
190
-
191
-
192
-
193
-
194
-
195
-
196
-
197
-
198
-
199
-
200
-
201
-
202
-
203
-
204
-
205
-
206
-
207
-
208
-
209
-
210
-
211
-
212
-
213
-
214
-
215
-
216
-
217
-
218
-
219
-
220
-
221
-
222
-
223
-
224
-
225
-
226
-
227
-
228
-
229
-
230
-
231
-
232
-
233
-
234
-
235
-
236
-
237
-
238
-
239
-
240
-
241
-
242
-
243
-
244
-
245
-
246
-
247
-
248
-
249
-
250
-
251
-
252
-
253
-
254
-
255
-
256
-
257
-
258
-
259
-
260
-
261
-
262
-
263
-
264
-
265
-
266
-
267
-
268
-
269
-
270
-
271
-
272
-
273
-
274
-
275
-
276
-
277
-
278
-
279
-
280
-
281
-
282
-
283
-
284
-
285
-
286
-
287
-
288
-
289
-
290
-
291
-
292
-
293
-
294
-
295
-
296
-
297
-
298
-
299
-
300
 |
 |

Change
December 31, 2014 vs. 2013 vs.
(Dollars in millions, except per share data and as noted) 2014 2013 2012 2011 2010 2013 2012
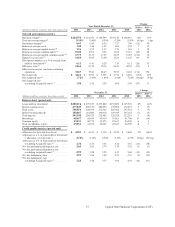
Capital ratios(18)
Common equityTier 1 capital ratio . . . . . . . . 12.46% N/A N/A N/A N/A ** **
Tier 1 common ratio . . . . . . . . . . . . . . . . . . . . N/A 12.19% 10.93% 9.63% 8.73% ** 126 bps
Tier 1 risk-based capital ratio . . . . . . . . . . . . . 13.23% 12.57 11.31 11.96 11.60 66 bps 126
Total risk-based capital ratio . . . . . . . . . . . . . . 15.14 14.69 13.53 14.82 16.79 45 116
Tier 1 leverage ratio . . . . . . . . . . . . . . . . . . . . . 10.77 10.06 8.63 10.04 8.1 71 143
Tangible common equity (“TCE”) ratio(19) . . . 9.49 8.89 7.87 8.18 6.82 60 102
Others
Employees (in thousands), period end(20) . . . . 46.0 45.4 42.2 34.1 30.3 1% 8%
** Change is not meaningful.
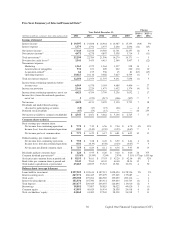
(1) We adopted ASU 2014-01 “Accounting for Investments in Qualified Affordable Housing Projects” (Investments in Qualified Affordable
Housing Projects) as of January 1, 2014. See “Note 1—Summary of Significant Accounting Policies” for additional information. Prior period
results and related metrics have been recast to conform to this presentation.
(2) Includes a bargain purchase gain of $594 million attributable to the ING Direct acquisition recognized in non-interest income in the first
quarter of 2012. The bargain purchase gain represents the excess of the fair value of the net assets acquired from ING Direct as of the
acquisition date over the consideration transferred.
(3) Total net revenue was reduced by $645 million, $796 million, $937 million, $371 million and $950 million in 2014, 2013, 2012, 2011, and
2010, respectively, for the estimated uncollectible amount of billed finance charges and fees. The reserve for estimated uncollectible billed
finance charges and fees, which we refer to as the finance charge and fee reserve, totaled $216 million, $190 million, $307 million, $74
million, and $211 million as of December 31, 2014, 2013, 2012, 2011, and 2010, respectively.
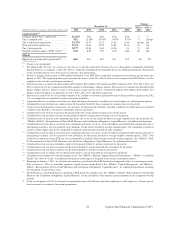
(4) Provision for credit losses for 2012 includes expense of $1.2 billion to establish an initial allowance for the receivables acquired in the 2012
U.S. card acquisition accounted for based on contractual cash flows.
(5) Acquisition-related costs include transaction costs, legal and other professional or consulting fees, restructuring costs, and integration expense.
(6) Calculated based on dividends per common share for the period divided by basic earnings per common share for the period.
(7) Consists of credit card purchase transactions, net of returns, for the period for both loans classified as held for investment and loans classified
as held for sale. Excludes cash advance and balance transfer transactions.
(8) Calculated based on total net revenue for the period divided by average interest-earning assets for the period.
(9) Calculated based on net interest income for the period divided by average interest-earning assets for the period.
(10) Calculated based on income from continuing operations, net of tax, for the period divided by average tangible assets for the period. See
“MD&A—Table F—Reconciliation of Non-GAAP Measures and Calculation of Regulatory Capital Measures” for additional information.
(11) Calculated based on the sum of (i) income from continuing operations, net of tax; (ii) less dividends and undistributed earnings allocated to
participating securities; (iii) less preferred stock dividends, for the period, divided by average common equity. Our calculation of return on
average common equity may not be comparable to similarly titled measures reported by other companies.
(12) Calculated based on the sum of (i) income from continuing operations, net of tax; (ii) less dividends and undistributed earnings allocated to
participating securities; (iii) less preferred stock dividends, for the period, divided by average tangible common equity (“TCE”). Our
calculation of return on average TCE may not be comparable to similarly titled measures reported by other companies. See “MD&A—Table
F—Reconciliation of Non-GAAP Measures and Calculation of Regulatory Capital Measures” for additional information.
(13) Calculated based on average stockholders’ equity for the period divided by average total assets for the period.
(14) Calculated based on non-interest expense for the period divided by average loans held for investment for the period.
(15) Calculated based on non-interest expense for the period divided by total net revenue for the period.
(16) Calculated based on net charge-offs for the period divided by average loans held for investment for the period.
(17) Calculation of ratio adjusted to exclude Acquired Loans. See “MD&A—Business Segment Financial Performance,” “MD&A—Credit Risk
Profile” and “Note 4—Loans” for additional information on the impact of Acquired Loans on our credit quality metrics.
(18) Beginning on January 1, 2014, we calculate our regulatory capital under Basel III Standardized Approach subject to transition provisions.
Prior to January 1, 2014, we calculated regulatory capital measures under Basel I. See “MD&A—Capital Management” and “MD&A—
Table F—Reconciliation of Non-GAAP Measures and Calculation of Regulatory Capital Measures” for additional information, including
the calculation of each of these ratios.
(19) The TCE ratio is a non-GAAP measure calculated as TCE divided by tangible assets. See “MD&A—Table F—Reconciliation of Non-GAAP
Measures and Calculation of Regulatory Capital Measures” for the calculation of this measure and reconciliation to the comparative GAAP
measure.
(20) In the second quarter of 2014, we changed our presentation from total full-time equivalent employees to total employees. All prior periods
have been recast to conform to the current presentation.
38 Capital One Financial Corporation (COF)