Capital One 2014 Annual Report Download - page 131
Download and view the complete annual report
Please find page 131 of the 2014 Capital One annual report below. You can navigate through the pages in the report by either clicking on the pages listed below, or by using the keyword search tool below to find specific information within the annual report.-
 1
1 -
2
-
3
-
4
-
5
-
6
-
7
-
8
-
9
-
10
-
11
-
12
-
13
-
14
-
15
-
16
-
17
-
18
-
19
-
20
-
21
-
22
-
23
-
24
-
25
-
26
-
27
-
28
-
29
-
30
-
31
-
32
-
33
-
34
-
35
-
36
-
37
-
38
-
39
-
40
-
41
-
42
-
43
-
44
-
45
-
46
-
47
-
48
-
49
-
50
-
51
-
52
-
53
-
54
-
55
-
56
-
57
-
58
-
59
-
60
-
61
-
62
-
63
-
64
-
65
-
66
-
67
-
68
-
69
-
70
-
71
-
72
-
73
-
74
-
75
-
76
-
77
-
78
-
79
-
80
-
81
-
82
-
83
-
84
-
85
-
86
-
87
-
88
-
89
-
90
-
91
-
92
-
93
-
94
-
95
-
96
-
97
-
98
-
99
-
100
-
101
-
102
-
103
-
104
-
105
-
106
-
107
-
108
-
109
-
110
-
111
-
112
-
113
-
114
-
115
-
116
-
117
-
118
-
119
-
120
-
 121
121 -
 122
122 -
 123
123 -
 124
124 -
 125
125 -
 126
126 -
 127
127 -
 128
128 -
 129
129 -
 130
130 -
 131
131 -
 132
132 -
 133
133 -
 134
134 -
 135
135 -
 136
136 -
 137
137 -
 138
138 -
 139
139 -
 140
140 -
 141
141 -
142
-
143
-
144
-
145
-
146
-
147
-
148
-
149
-
150
-
151
-
152
-
153
-
154
-
155
-
156
-
157
-
158
-
159
-
160
-
161
-
162
-
163
-
164
-
165
-
166
-
167
-
168
-
169
-
170
-
171
-
172
-
173
-
174
-
175
-
176
-
177
-
178
-
179
-
180
-
181
-
182
-
183
-
184
-
185
-
186
-
187
-
188
-
189
-
190
-
191
-
192
-
193
-
194
-
195
-
196
-
197
-
198
-
199
-
200
-
201
-
202
-
203
-
204
-
205
-
206
-
207
-
208
-
209
-
210
-
211
-
212
-
213
-
214
-
215
-
216
-
217
-
218
-
219
-
220
-
221
-
222
-
223
-
224
-
225
-
226
-
227
-
228
-
229
-
230
-
231
-
232
-
233
-
234
-
235
-
236
-
237
-
238
-
239
-
240
-
241
-
242
-
243
-
244
-
245
-
246
-
247
-
248
-
249
-
250
-
251
-
252
-
253
-
254
-
255
-
256
-
257
-
258
-
259
-
260
-
261
-
262
-
263
-
264
-
265
-
266
-
267
-
268
-
269
-
270
-
271
-
272
-
273
-
274
-
275
-
276
-
277
-
278
-
279
-
280
-
281
-
282
-
283
-
284
-
285
-
286
-
287
-
288
-
289
-
290
-
291
-
292
-
293
-
294
-
295
-
296
-
297
-
298
-
299
-
300
 |
 |
our AOCI exposure. We apply hedge accounting to these net investment hedges. We measure our total exposure
by regularly tracking the value of our net equity invested in our foreign operations as well as their funding
requirements.
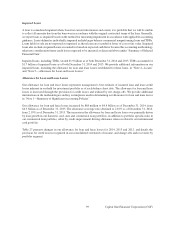
Also, beginning in the third quarter of 2014, we revised our methodology to measure our exposure to foreign
exchange rates by measuring the change in equity value of our net investments in our U.K. and Canadian
operations. We apply a 30 percent U.S. dollar appreciation shock against each of our Great British Pound
(“GBP”) and Canadian Dollar (“CAD”) net investment exposure. This value-at-risk analysis approximates a 99
percent confidence interval over a one year time horizon for our combined GBP and CAD net investment
exposure. As of December 31, 2014 our gross equity exposures were 1.3 billion GBP and 581 million CAD. As
a result of our derivative management activities, we believe our net exposure to foreign exchange risk is minimal.
Our gross equity exposures as of December 31, 2013 were 1.2 billion GBP and 655 million CAD.
Market Risk Management
We employ several techniques to manage our interest rate and foreign exchange risk, which include, but are not
limited to, altering the duration and re-pricing characteristics of our various assets and liabilities through interest
rate derivatives or mitigating the foreign exchange exposure of certain non-dollar denominated equity or transactions
through derivatives. Derivatives are one of the primary tools we use in managing interest rate and foreign exchange
risk. Our current asset/liability management policy includes the use of derivatives. We execute our derivative contracts
in both over-the-counter and exchange-traded derivative markets. Although the majority of our derivatives are interest
rate swaps, we also use a variety of other derivative instruments, including caps, floors, options, futures and forward
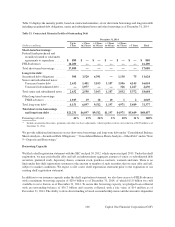
contracts, to manage both our interest rate and foreign currency risk. The outstanding notional amount of our
derivative contracts totaled $88.6 billion as of December 31, 2014, compared to $63.4 billion as of December 31,
2013, driven by an increase in our hedging activities.
Market Risk Measurement
We have prescribed risk management policies and limits established by our Market and Liquidity Risk Policy and
approved by the Board of Directors. Our objective is to manage our asset/liability risk position and exposure to
market risk in accordance with these policies and prescribed limits based on prevailing market conditions and long-
term expectations. Because no single measure can reflect all aspects of market risk, we use various industry standard
market risk measurement techniques and analysis to measure, assess and manage the impact of changes in interest
rates on our net interest income and our economic value of equity and foreign exchange rates on our non-dollar
denominated earnings and non-dollar equity investments in foreign operations. We provide additional information
below in “Economic Value of Equity.”
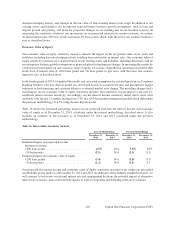
We consider the impact on both net interest income and economic value of equity in measuring and managing our
interest rate risk. Because the federal funds rate was lowered to near zero in December 2008 and since then has
remained in a target range of 0% to 0.25%, we use a 50 basis points decrease as our declining interest rate scenario,
since a scenario where interest rates would decline by 200 basis points is unlikely. In scenarios where a 50 basis
points decline would result in a rate less than 0%, we assume a rate of 0%. Below we discuss the assumptions used
in calculating each of these measures.
Net Interest Income Sensitivity
This sensitivity measure estimates the impact on our projected 12-month base-line interest rate sensitive revenue
resulting from movements in interest rates. Interest rate sensitive revenue consists of net interest income and
certain components of other non-interest income significantly impacted by movements in interest rates, including
changes in the fair value of mortgage servicing rights and free-standing interest rate swaps. Adjusted net interest
income consists of net interest income and changes in the fair value of mortgage servicing rights, including related
109 Capital One Financial Corporation (COF)